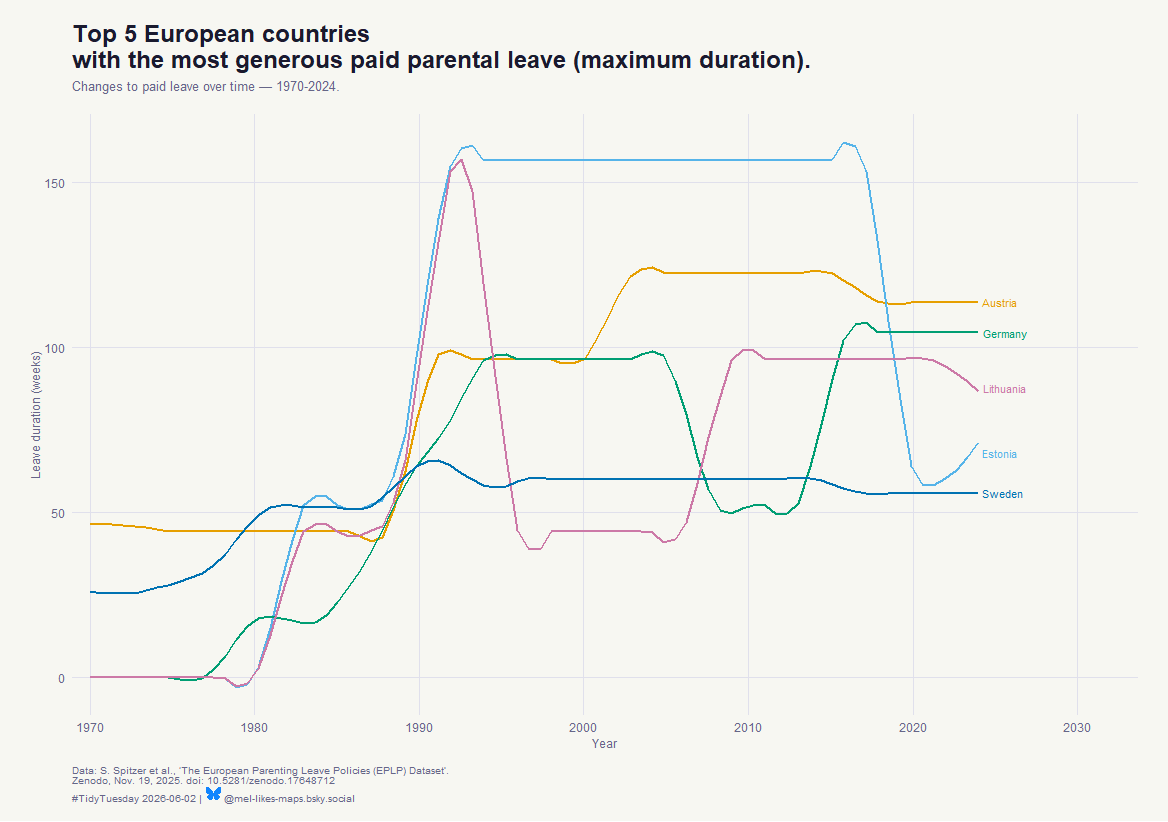
I really struggled with this one. I looked at the 5 countries with the most generous paid parental leave in 2024 to see how leave duration has changed over the course of this data set. The amounts have shifted — in both directions — more than I expected.
#TidyTuesday #rstats #dataviz
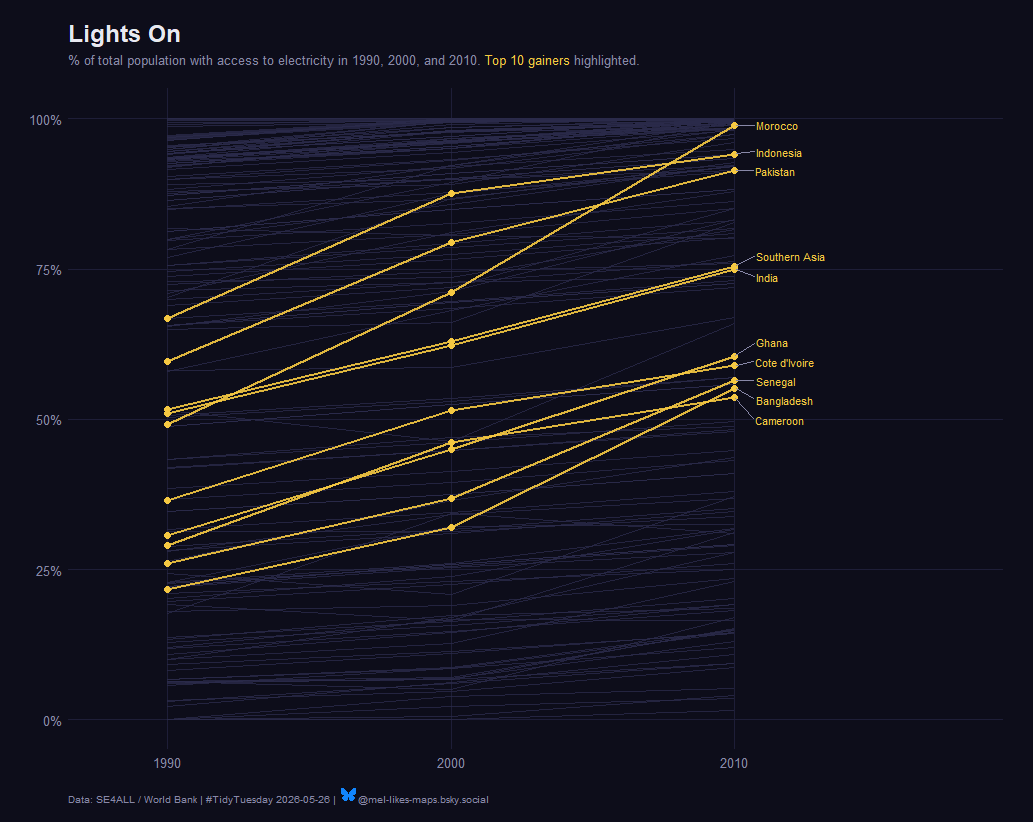
This week’s #TidyTuesday (2026/05/26) is tracking electricity access by country using the SE4ALL dataset.
Morocco topped the list of biggest gains, going from ~67% to nearly 100% over two decades. #rstats #dataviz
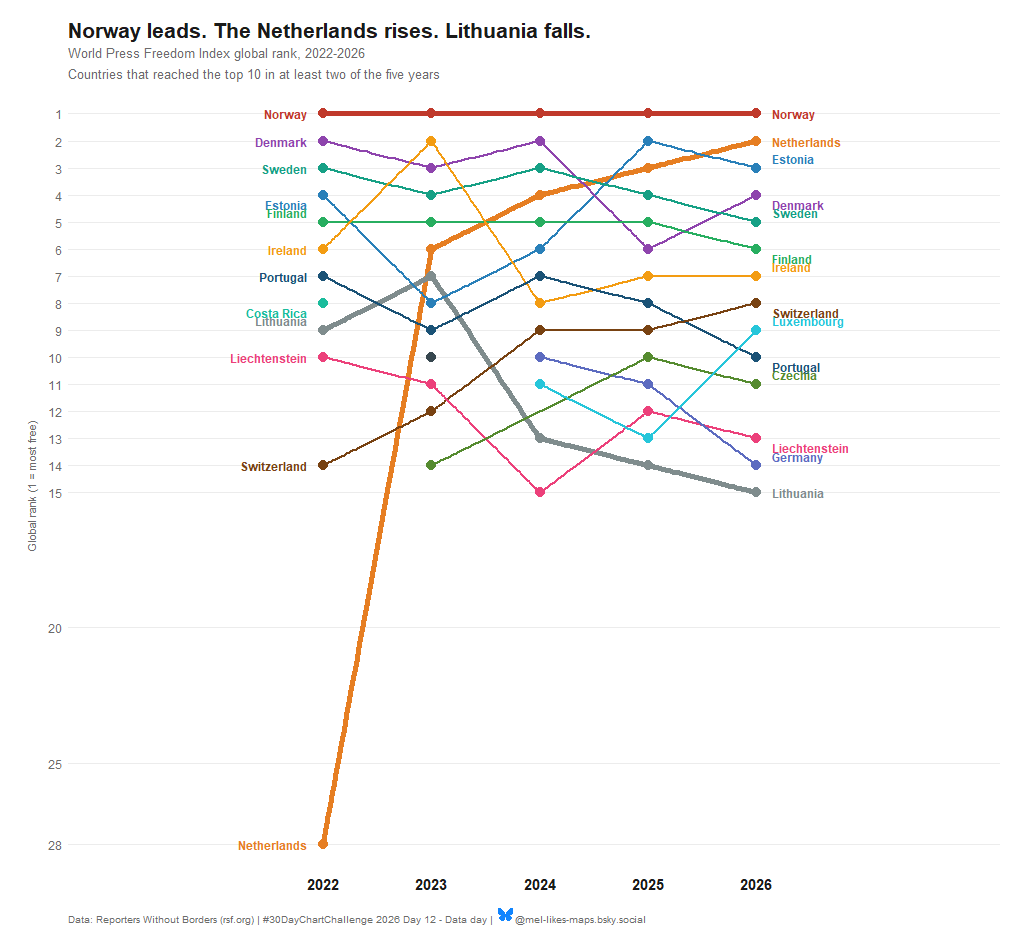
Day 12 of #30DayChartChallenge: Reporters without borders. Unpolished, but it still tells a story. Five years of global press freedom rankings. Norway never moves. The Netherlands went from 28th to 2nd. #rstats #dataviz
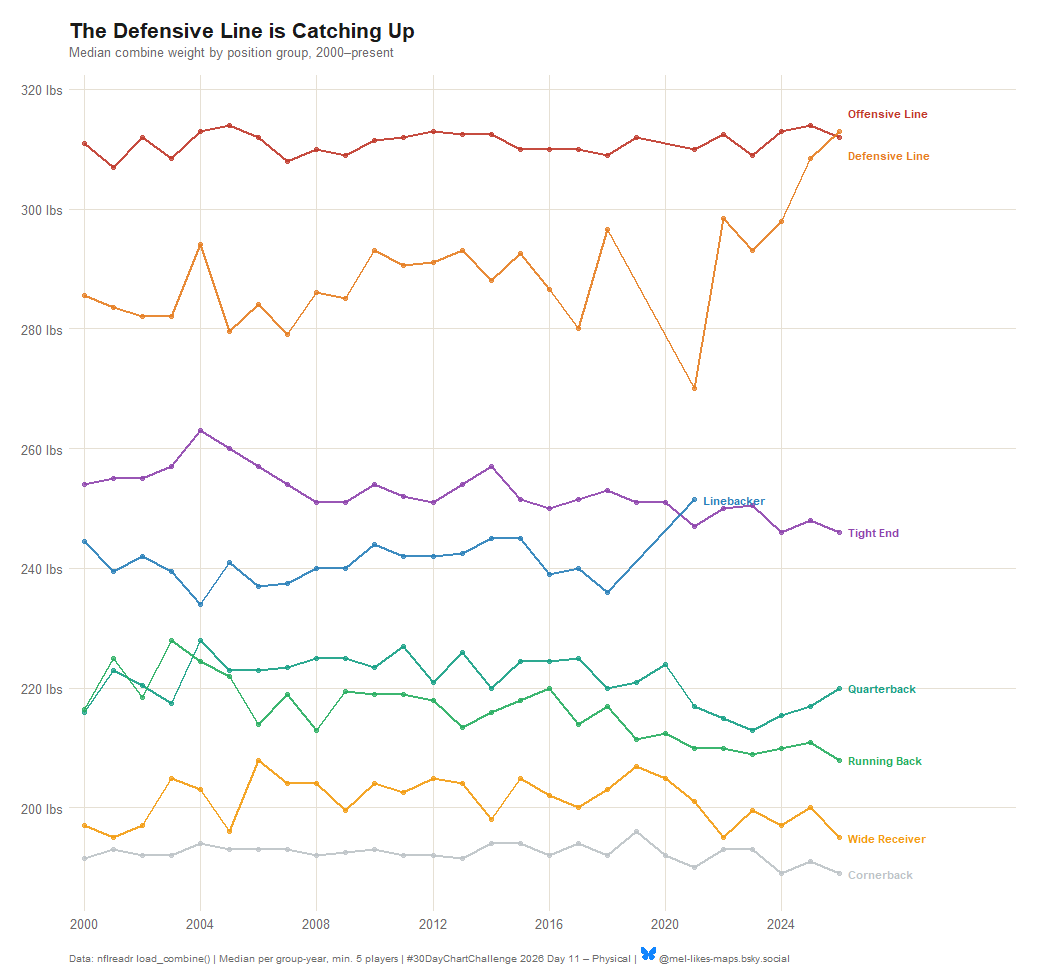
Day 11 of #30DayChartChallenge: Physical 🏈 NFL players are getting heavier. But the most interesting line on this chart isn’t the biggest one. Offensive linemen have always been the heaviest players at the combine, but defensive linemen have closed the gap since 2000. #Rstats #DataViz
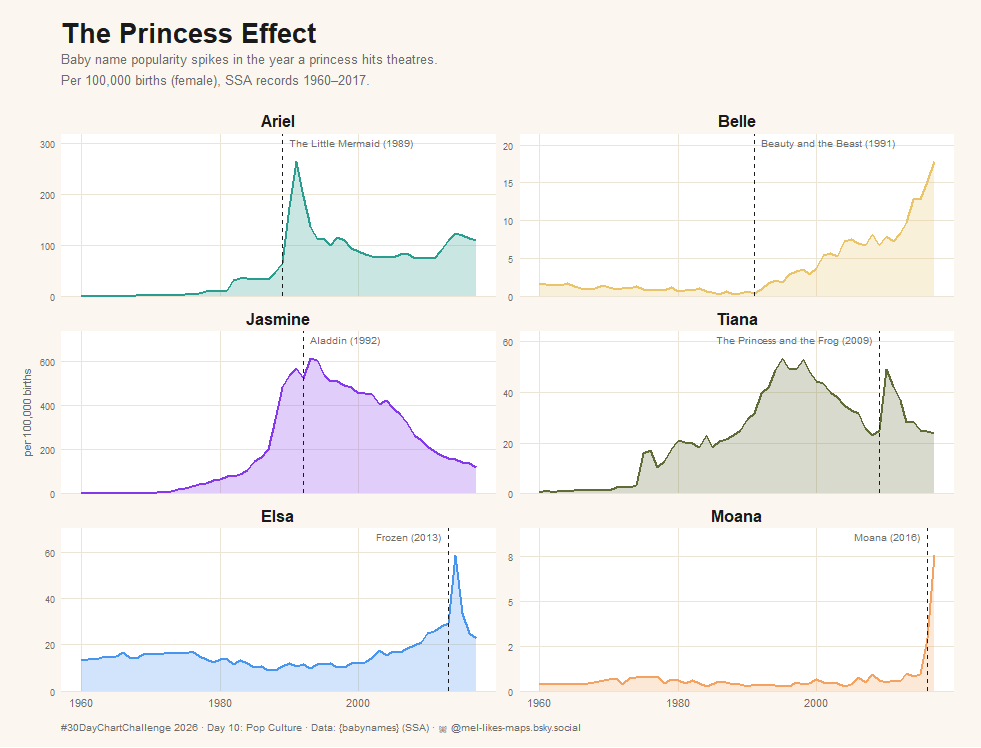
Day 10 of #30DayChartChallenge: Pop culture 🎭 Every Disney princess leaves their mark on the baby name records. Six princesses. Six spikes. Even names that were already in use get a boost from the movies. #rstats #DataViz
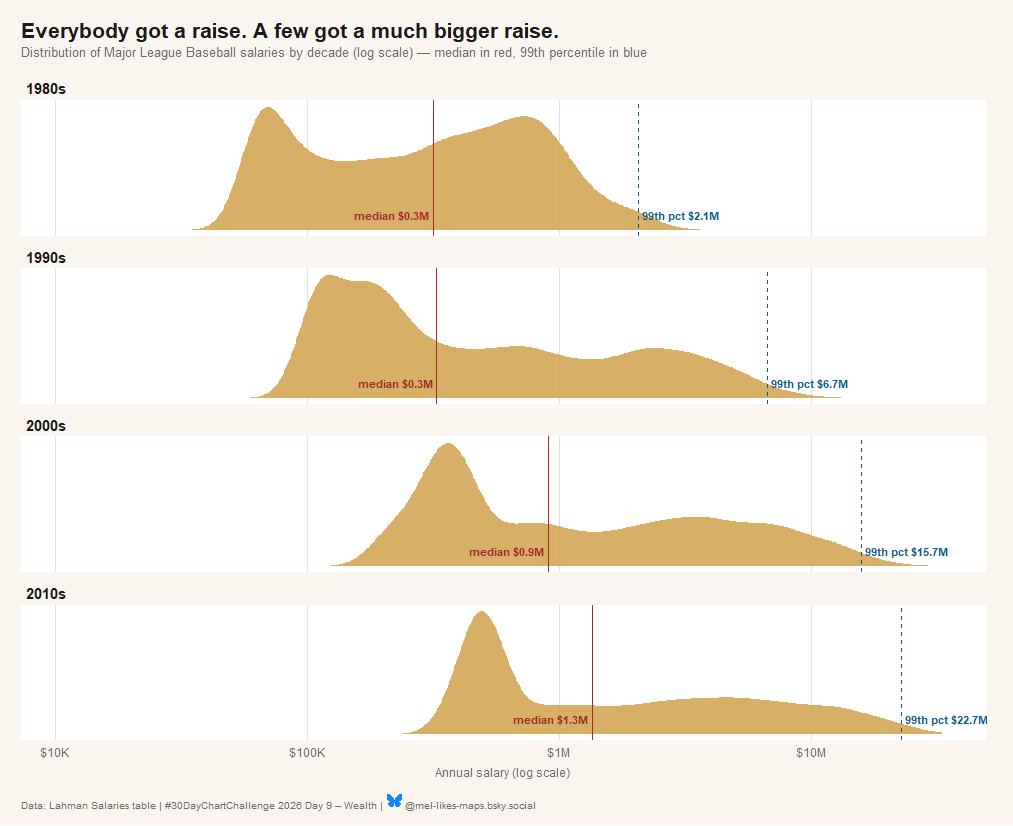
Day 9 of #30DayChartChallenge: Wealth. Back to baseball data for this one. MLB salaries on a log scale, one decade per row, 1985 to 2016. The red line (median) creeps forward. The blue line (99th percentile) runs away from it. #rstats #dataviz
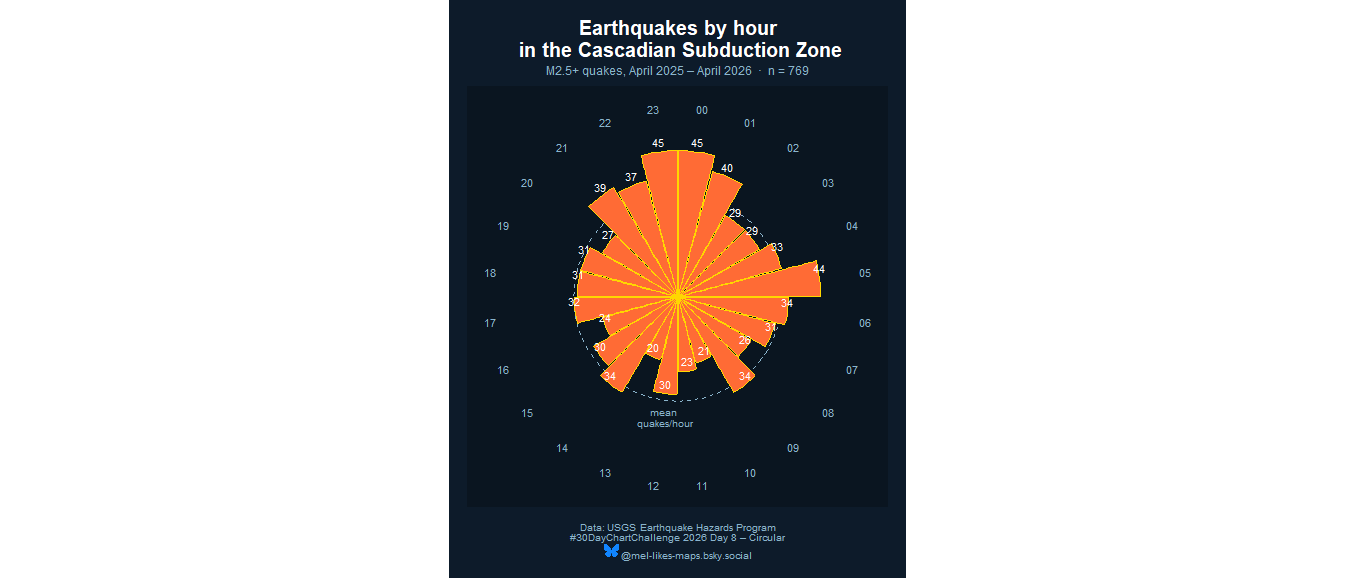
Day 8 of #30DayChartChallenge: Circular. Continuing the USGS earthquake theme – a circular histogram of Cascadia Subduction Zone M2.5+ quakes binned by local hour of day (Pacific time). #rstats #dataviz
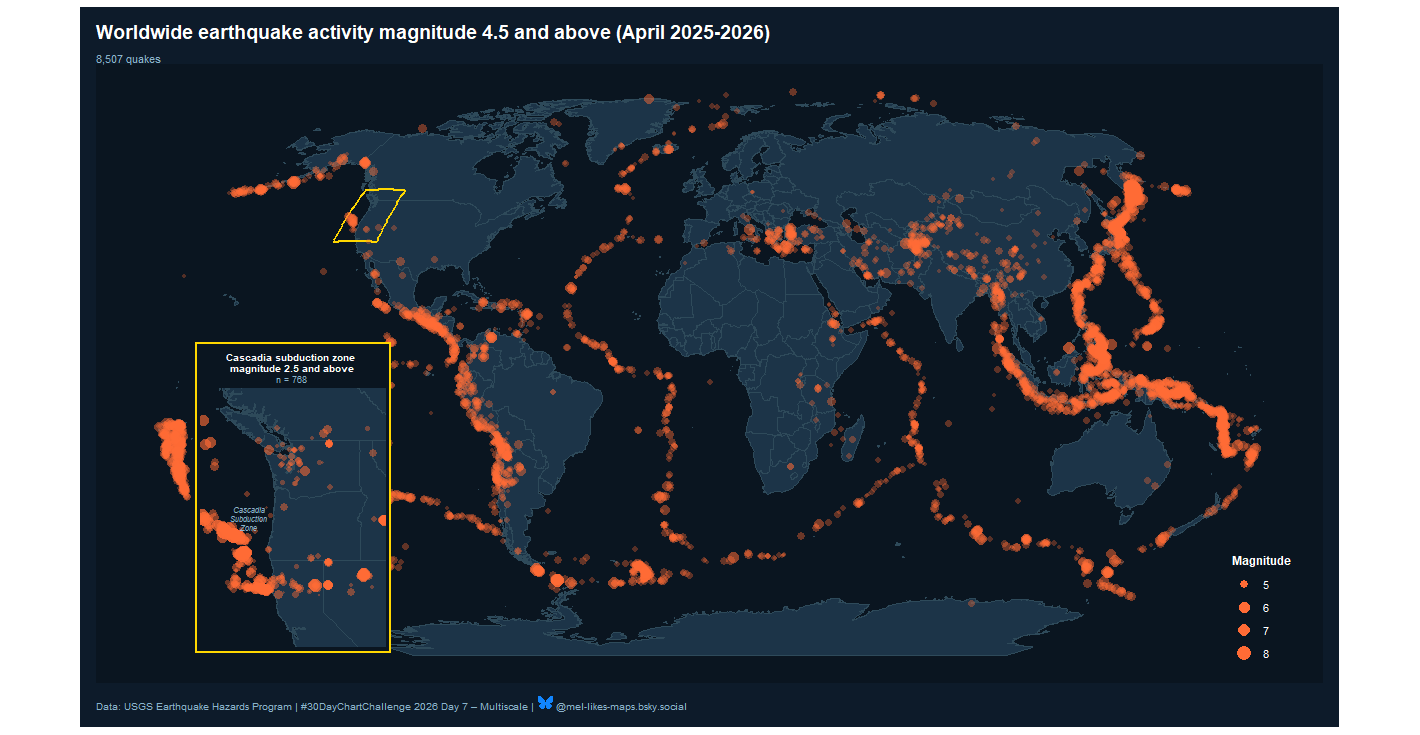
Day 7 of #30DayChartChallenge: Multiscale. Looking at earthquake activity worldwide and at a regional scale. Different stories at different scales. Made with #rstats + USGS. #dataviz
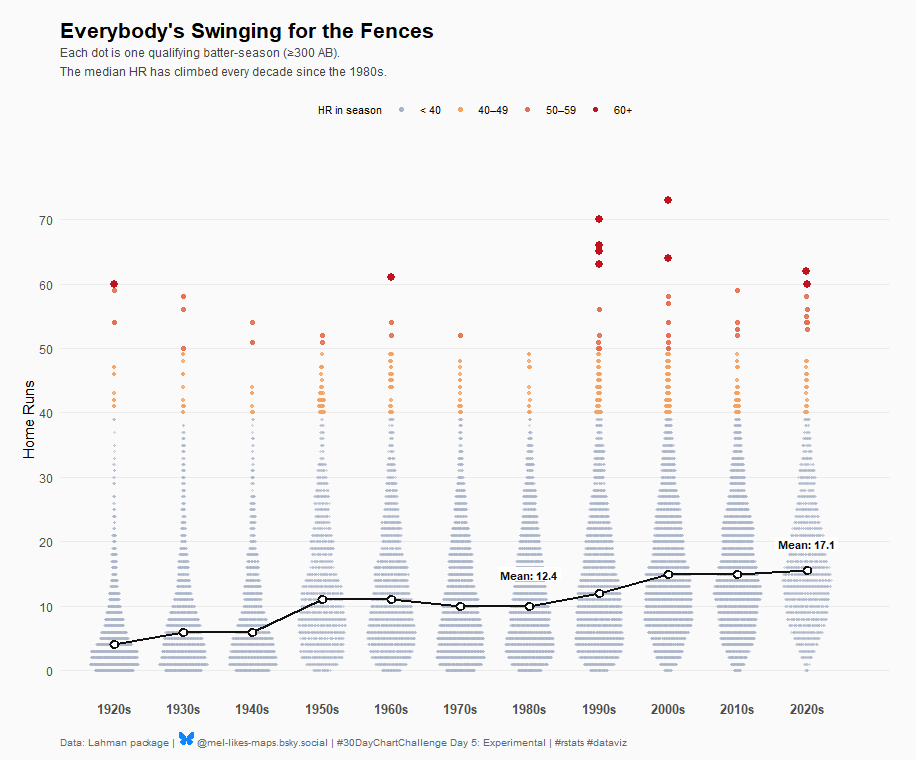
Day 5 of #30DayChartChallenge: Experimental — first time making a beeswarm! The big HR hitters get the attention, but the interesting story is the floor rising. Mean HR for a qualified batter: 12.4 in the 1980s → 17.1 in the 2020s. Everybody’s swinging for the fences. #rstats #dataviz
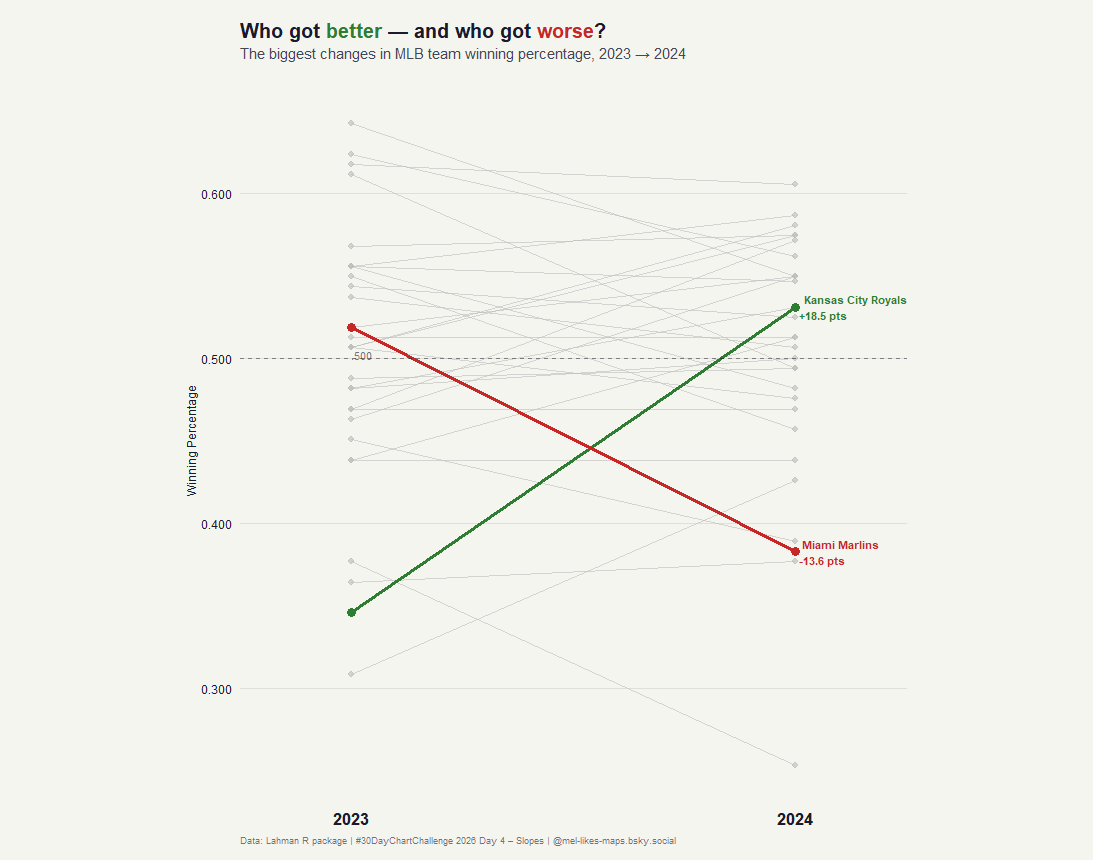
Sticking with the same general dataset across multiple charts is helping me stay on track with the #30DayChartChallenge. The Royals had the biggest turnaround in MLB from 2023 → 2024. The Marlins had the biggest fall. Day 4 : Slope — all 30 teams, two seasons, one line each. #rstats #dataviz
It’s baseball season, and someone told me there are no lefty catchers in MLB. So I dug into the Lahman database for #30DayChartChallenge Day 3 (Mosaic) — sure enough, catchers are the most right-handed position in the game. #rstats #dataviz
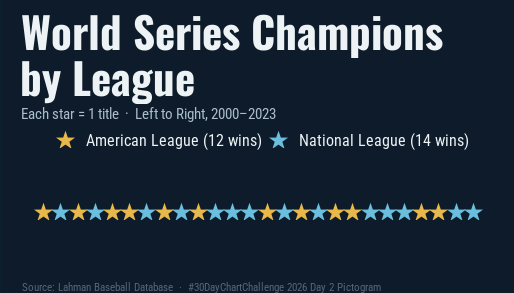
For Day 2 of #30DayChartChallenge (Pictogram), I kept digging into the Lahman baseball database in R. Each ⭐ = one World Series title since 2000, gold for AL, blue for NL. #rstats #dataviz
#30DayChartChallenge Day 1
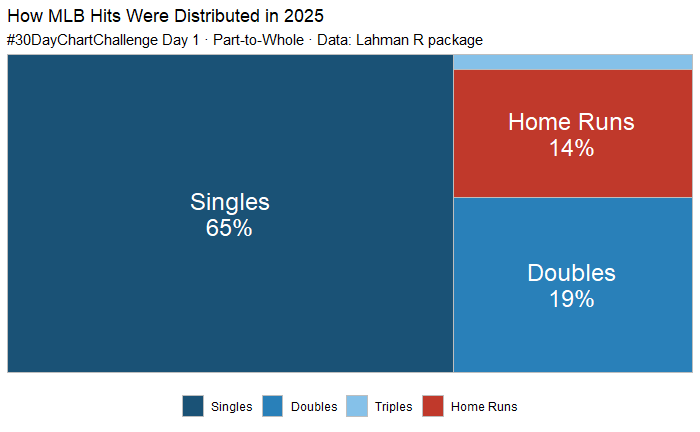
Triples are hard to come by… Here’s the distribution of MLB hits, by type in 2025. Made with data from the Lahmen package. #rstats
Day 14 of #30DayMapChallenge: OpenStreetMap 🗺️ I haven’t really explored OSM data before, but the level of detail in my area of interest was great. Here’s a quick map of places you can sit and read at the park. Built with #rstats and ggplot2 📍
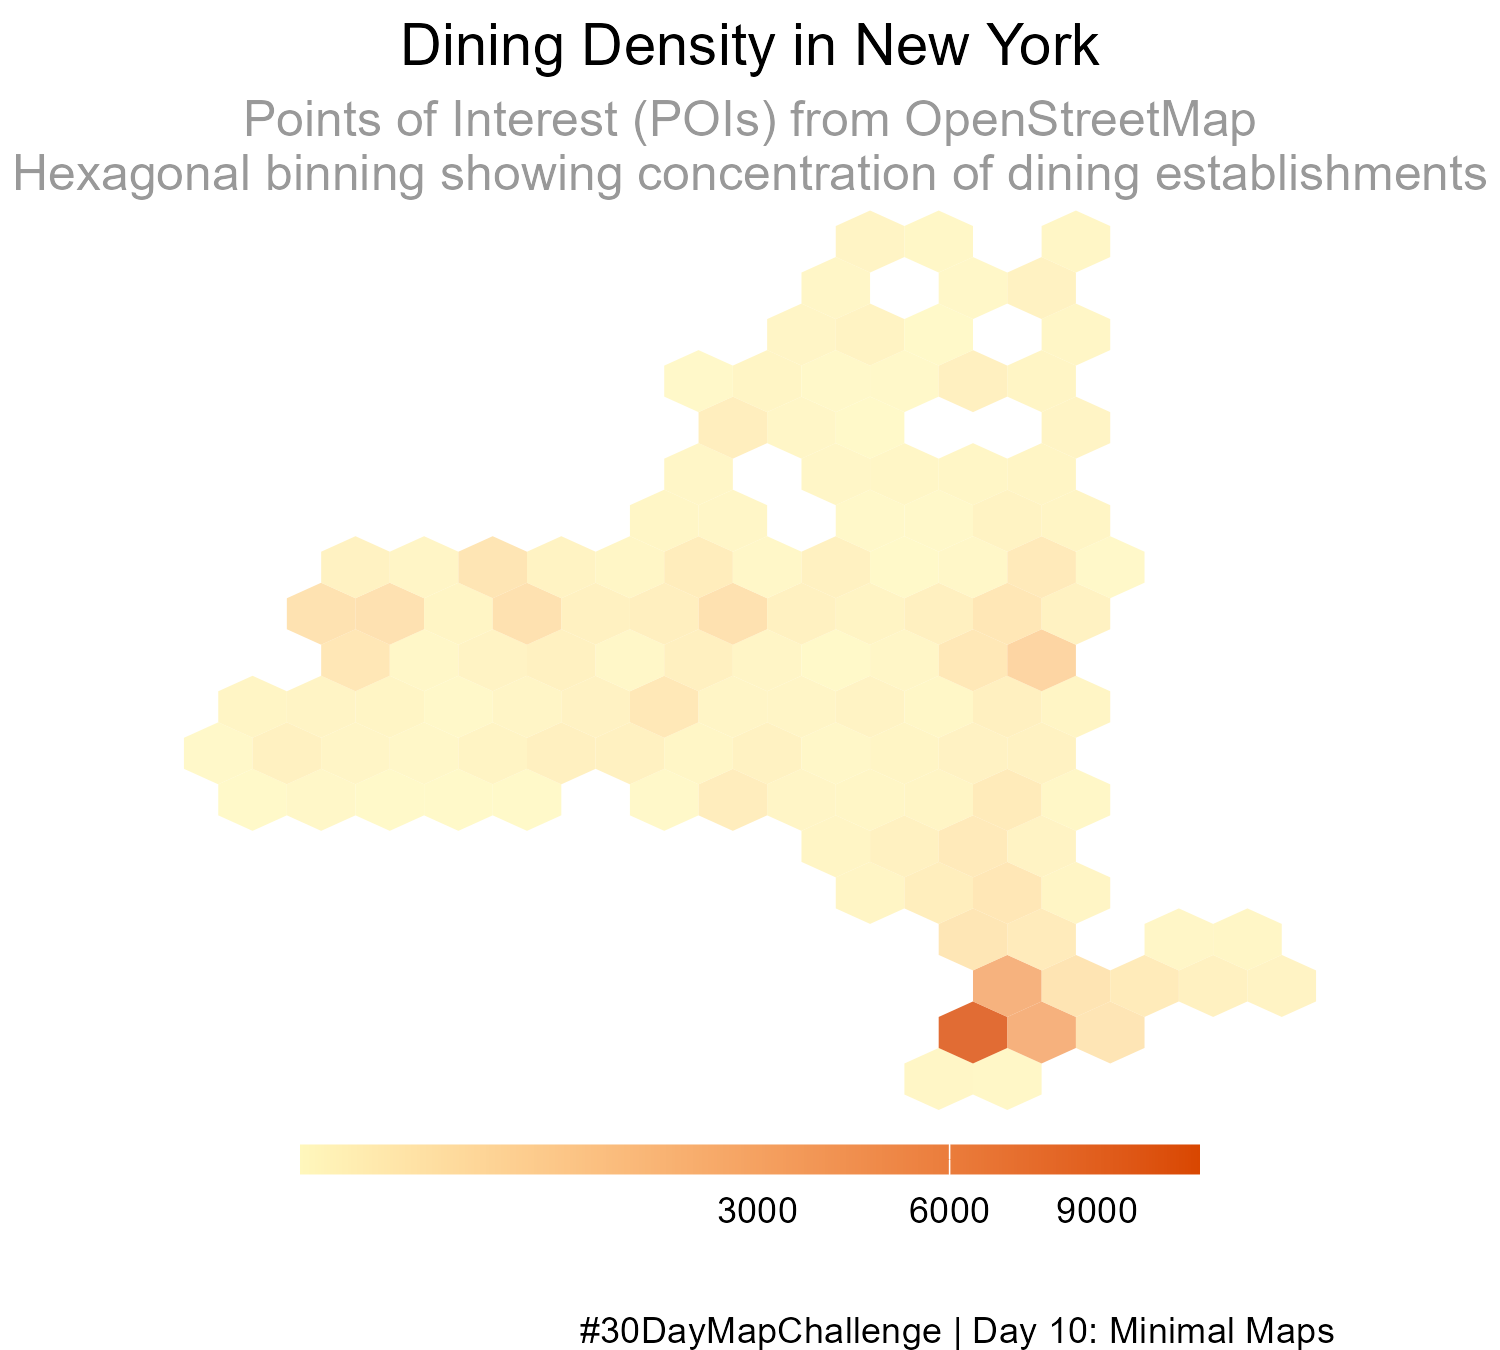
I wanted more practice using OpenStreetMap data. Here is a hexagonal map of dining places in New York State, made in #rstats using OSM point-of-interest data. #30DayMapChallenge Day 10: Minimal Maps. #gis
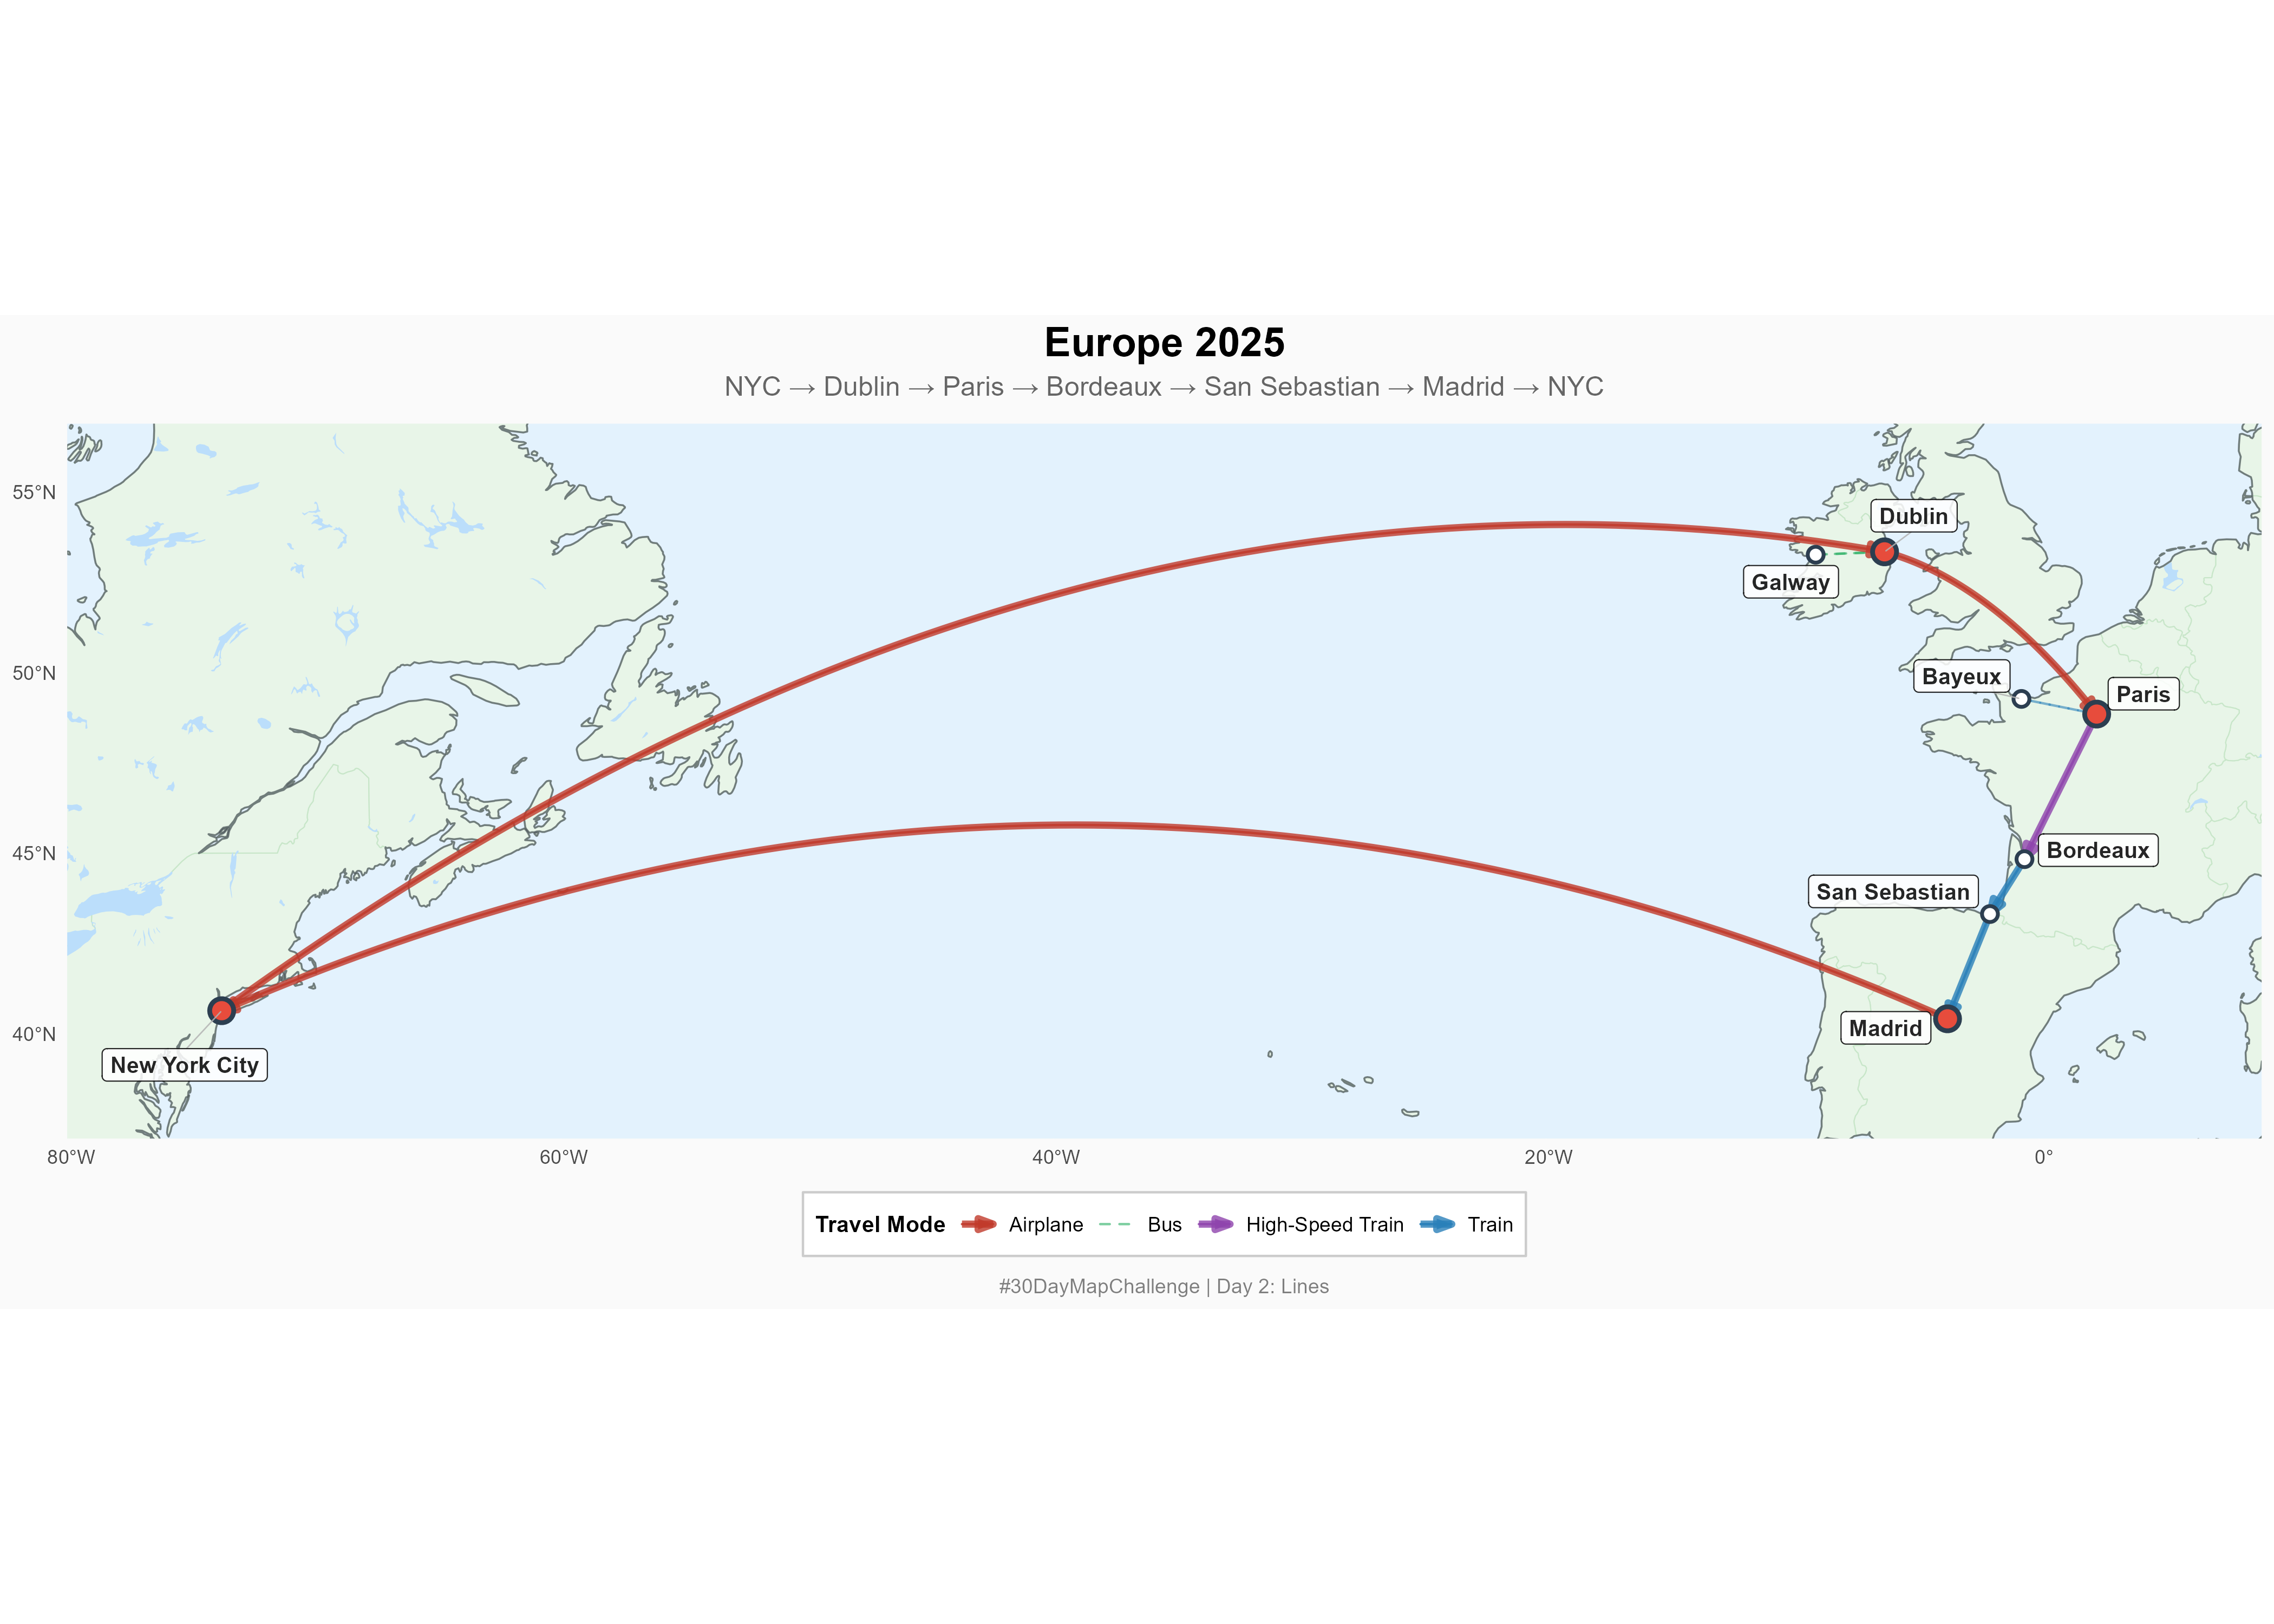
#30DayMapChallenge Day 2: Lines. I wanted to make a quick map of my summer vacation using #rstats. I couldn’t get the arrows to display correctly, so that is still a work in progress. GitHub: https://github.com/mhegeman/30DayMapChallenge_2025
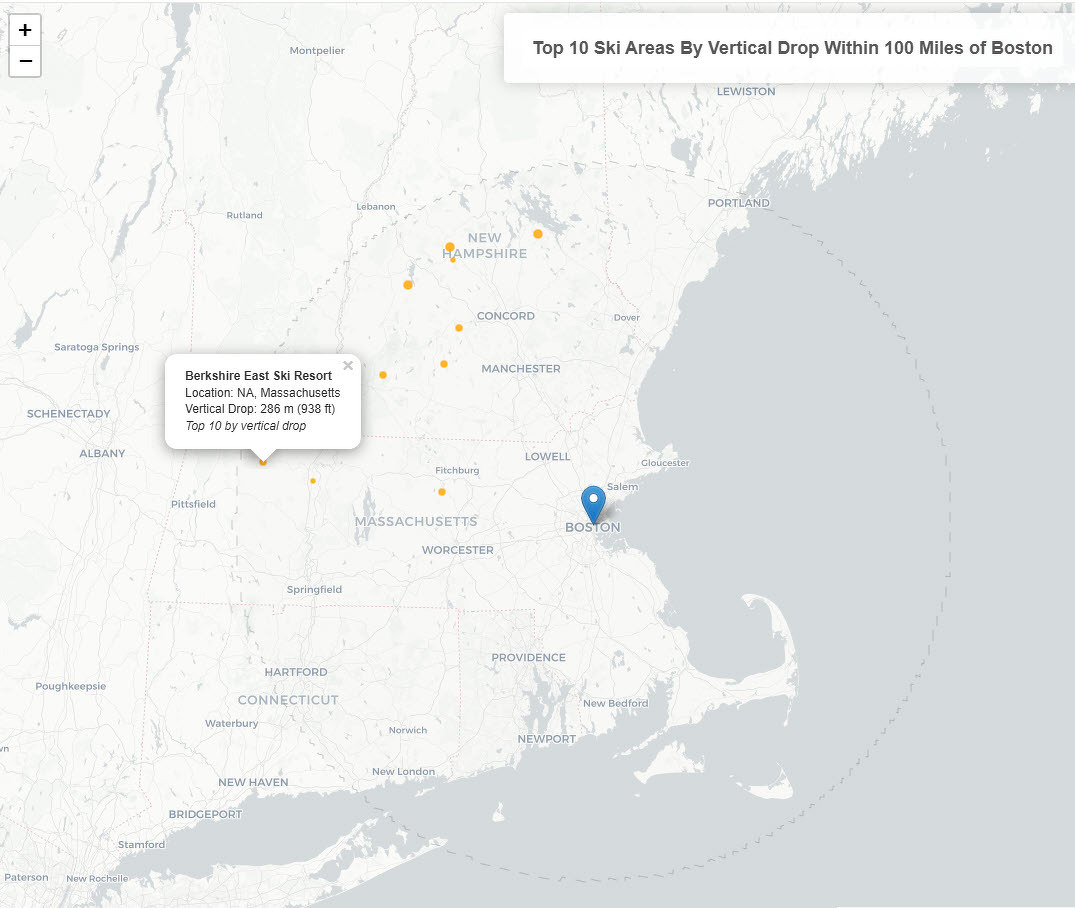
Trying to catch up on the #30DayMapChallenge Day 1: Points. Since it is almost ski season in the Northern Hemisphere, I wanted to find the top 10 ski resorts with the most significant vertical drop within 100 miles of Boston. I used data from Open Ski Map and made the map in R using Leaflet.
Fell a bit off the #AdventOfCode wagon, but trying to get back at it. I work almost exclusively with dataframes as inputs, this reminds me that there are other data structures. Completed “Print Queue” - Day 5 adventofcode.com/2024/day/… GitHub: github.com/mhegeman/…
Just completed “Ceres Search” Day 4 of Advent of Code 2024. Part 1 was a breeze, boosting my confidence, but Part 2 fixed that. As usual, I was overthinking it. #Python #AdventOfCode adventofcode.com/2024/day/… Github: github.com/mhegeman/…