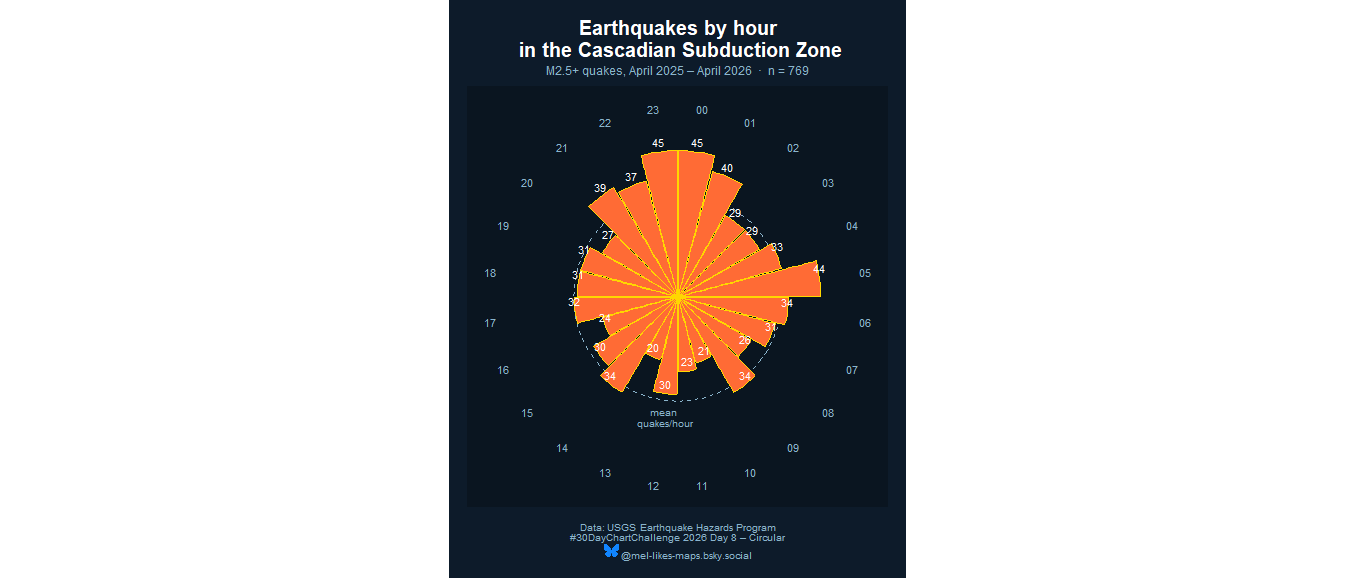
Thursday, April 23, 2026
Day 8 of #30DayChartChallenge: Circular. Continuing the USGS earthquake theme – a circular histogram of Cascadia Subduction Zone M2.5+ quakes binned by local hour of day (Pacific time). #rstats #dataviz
Thursday, April 23, 2026
Day 8 of #30DayChartChallenge: Circular. Continuing the USGS earthquake theme – a circular histogram of Cascadia Subduction Zone M2.5+ quakes binned by local hour of day (Pacific time). #rstats #dataviz