Wednesday, April 29, 2026
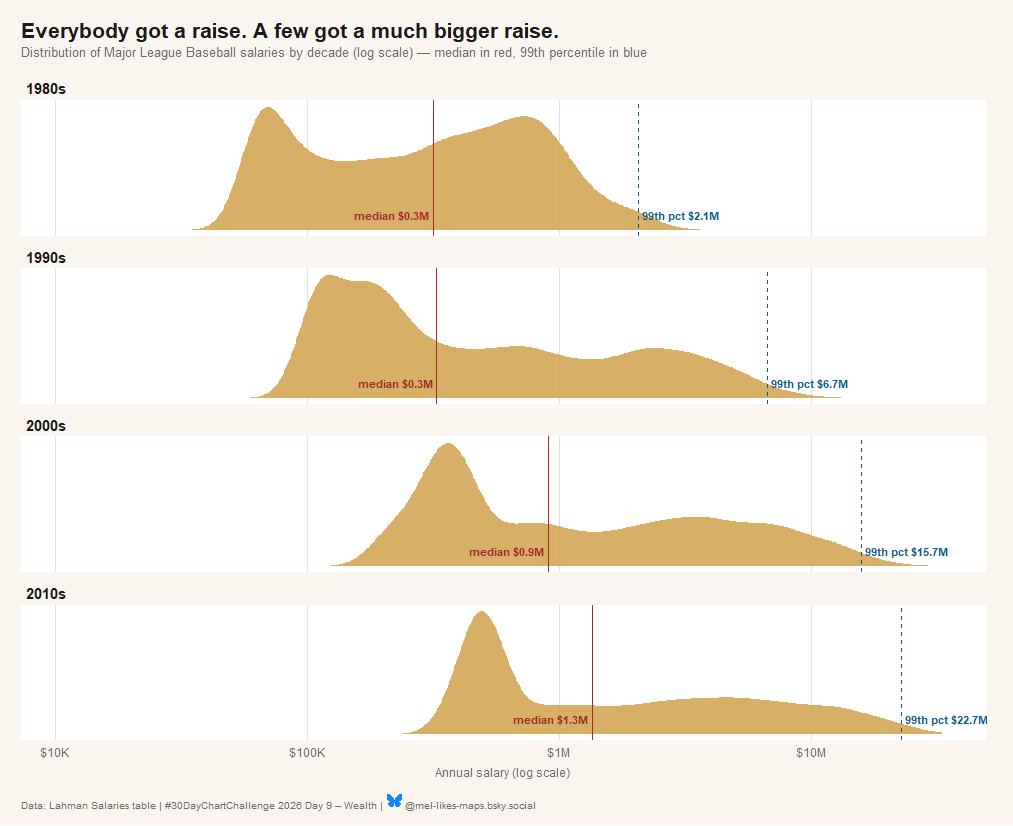
Day 9 of #30DayChartChallenge: Wealth. Back to baseball data for this one. MLB salaries on a log scale, one decade per row, 1985 to 2016. The red line (median) creeps forward. The blue line (99th percentile) runs away from it. #rstats #dataviz