Friday, April 17, 2026
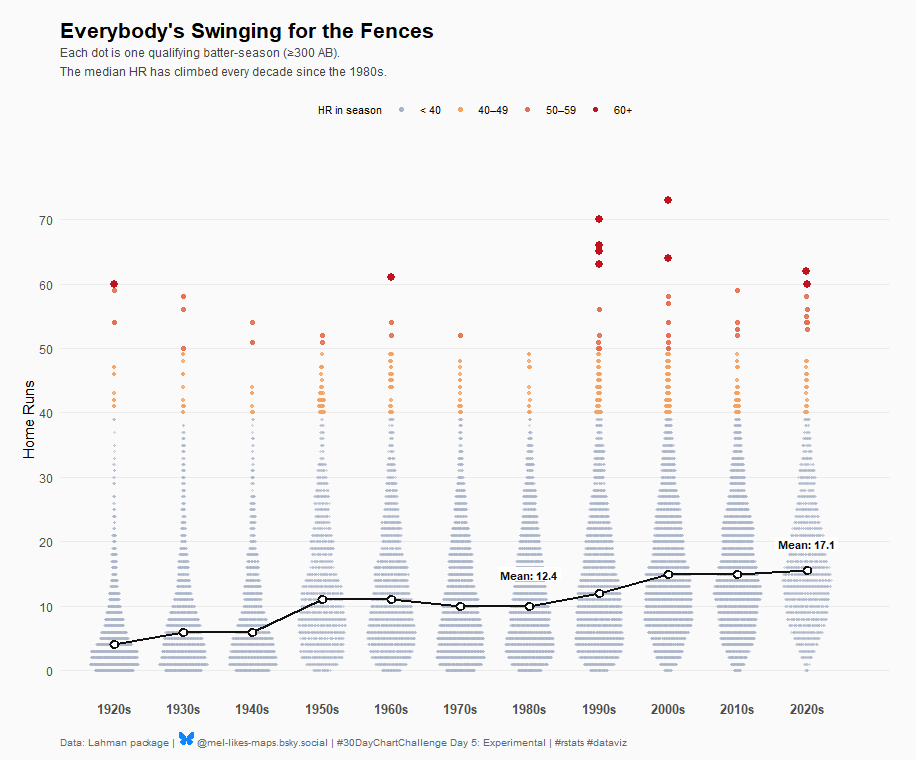
Day 5 of #30DayChartChallenge: Experimental — first time making a beeswarm! The big HR hitters get the attention, but the interesting story is the floor rising. Mean HR for a qualified batter: 12.4 in the 1980s → 17.1 in the 2020s. Everybody’s swinging for the fences. #rstats #dataviz