Day 14 of #30DayMapChallenge: OpenStreetMap 🗺️ I haven’t really explored OSM data before, but the level of detail in my area of interest was great. Here’s a quick map of places you can sit and read at the park. Built with #rstats and ggplot2 📍

Day 14 of #30DayMapChallenge: OpenStreetMap 🗺️ I haven’t really explored OSM data before, but the level of detail in my area of interest was great. Here’s a quick map of places you can sit and read at the park. Built with #rstats and ggplot2 📍
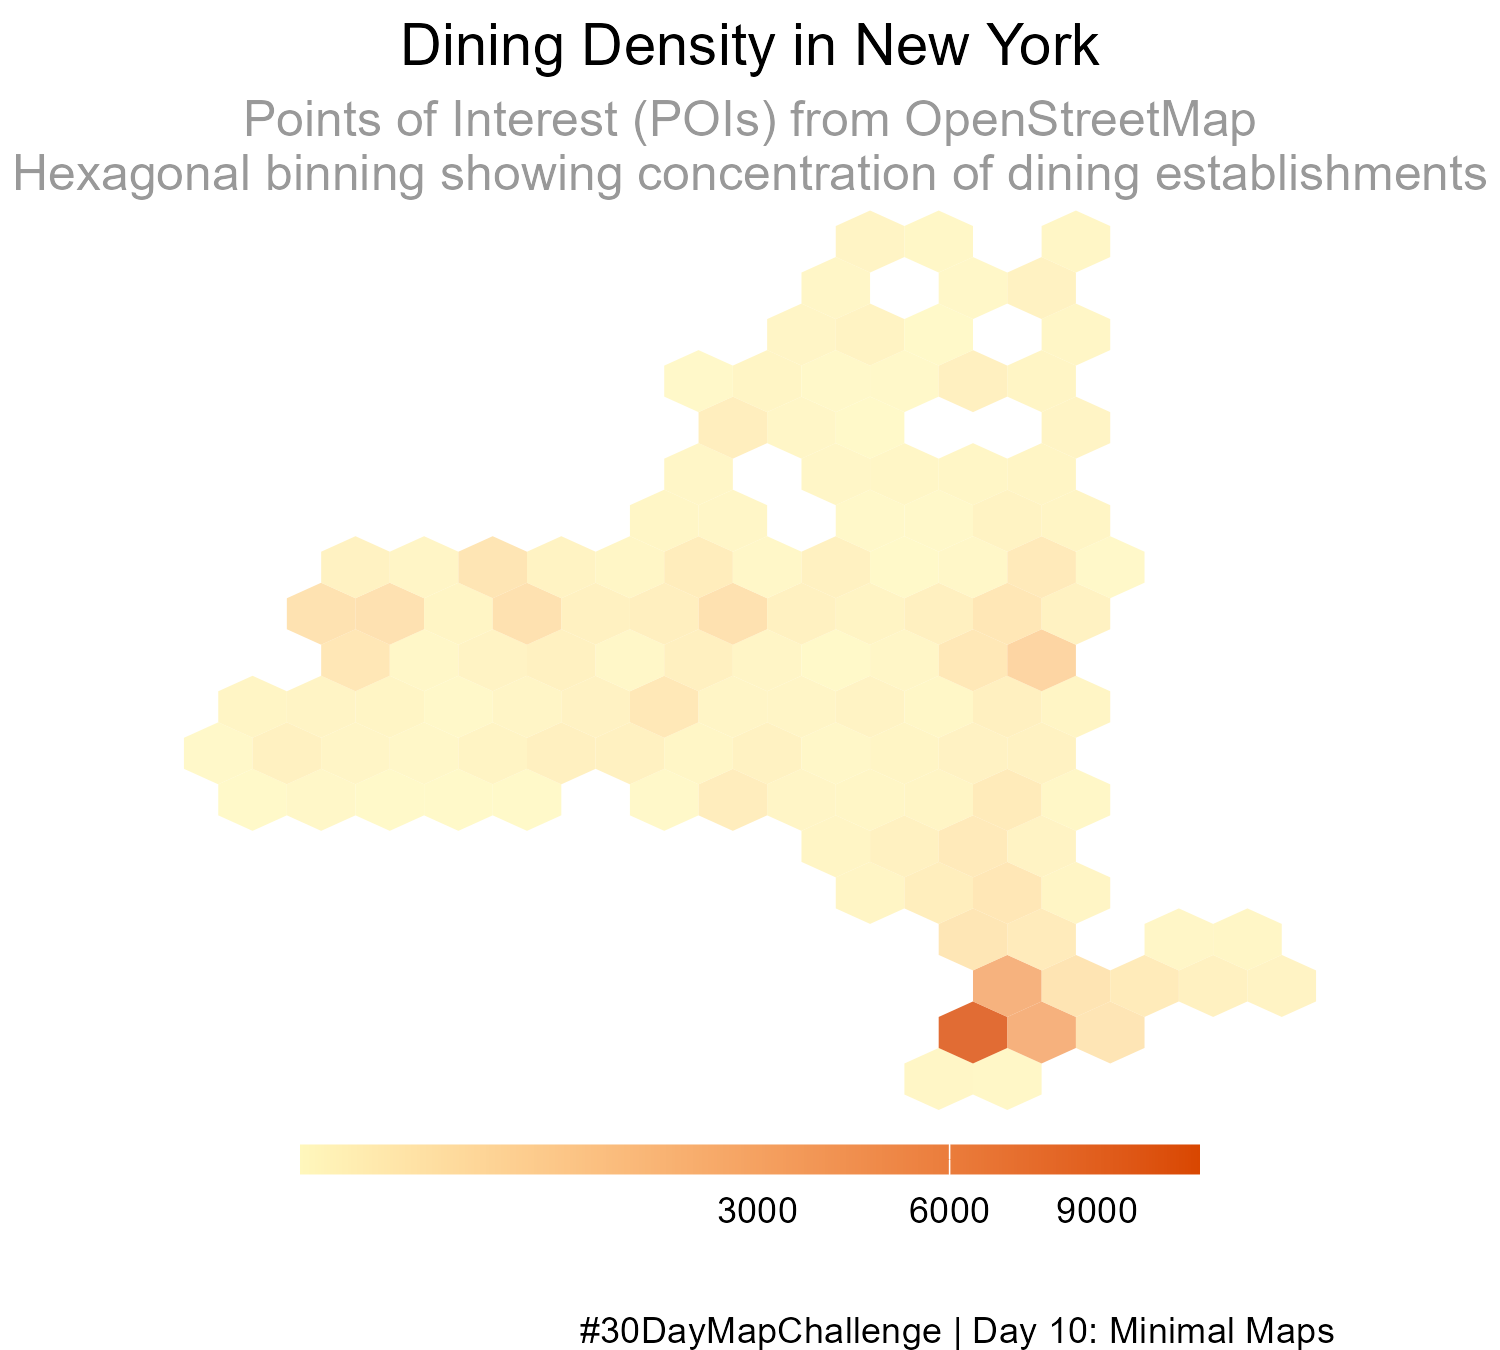
I wanted more practice using OpenStreetMap data. Here is a hexagonal map of dining places in New York State, made in #rstats using OSM point-of-interest data. #30DayMapChallenge Day 10: Minimal Maps. #gis
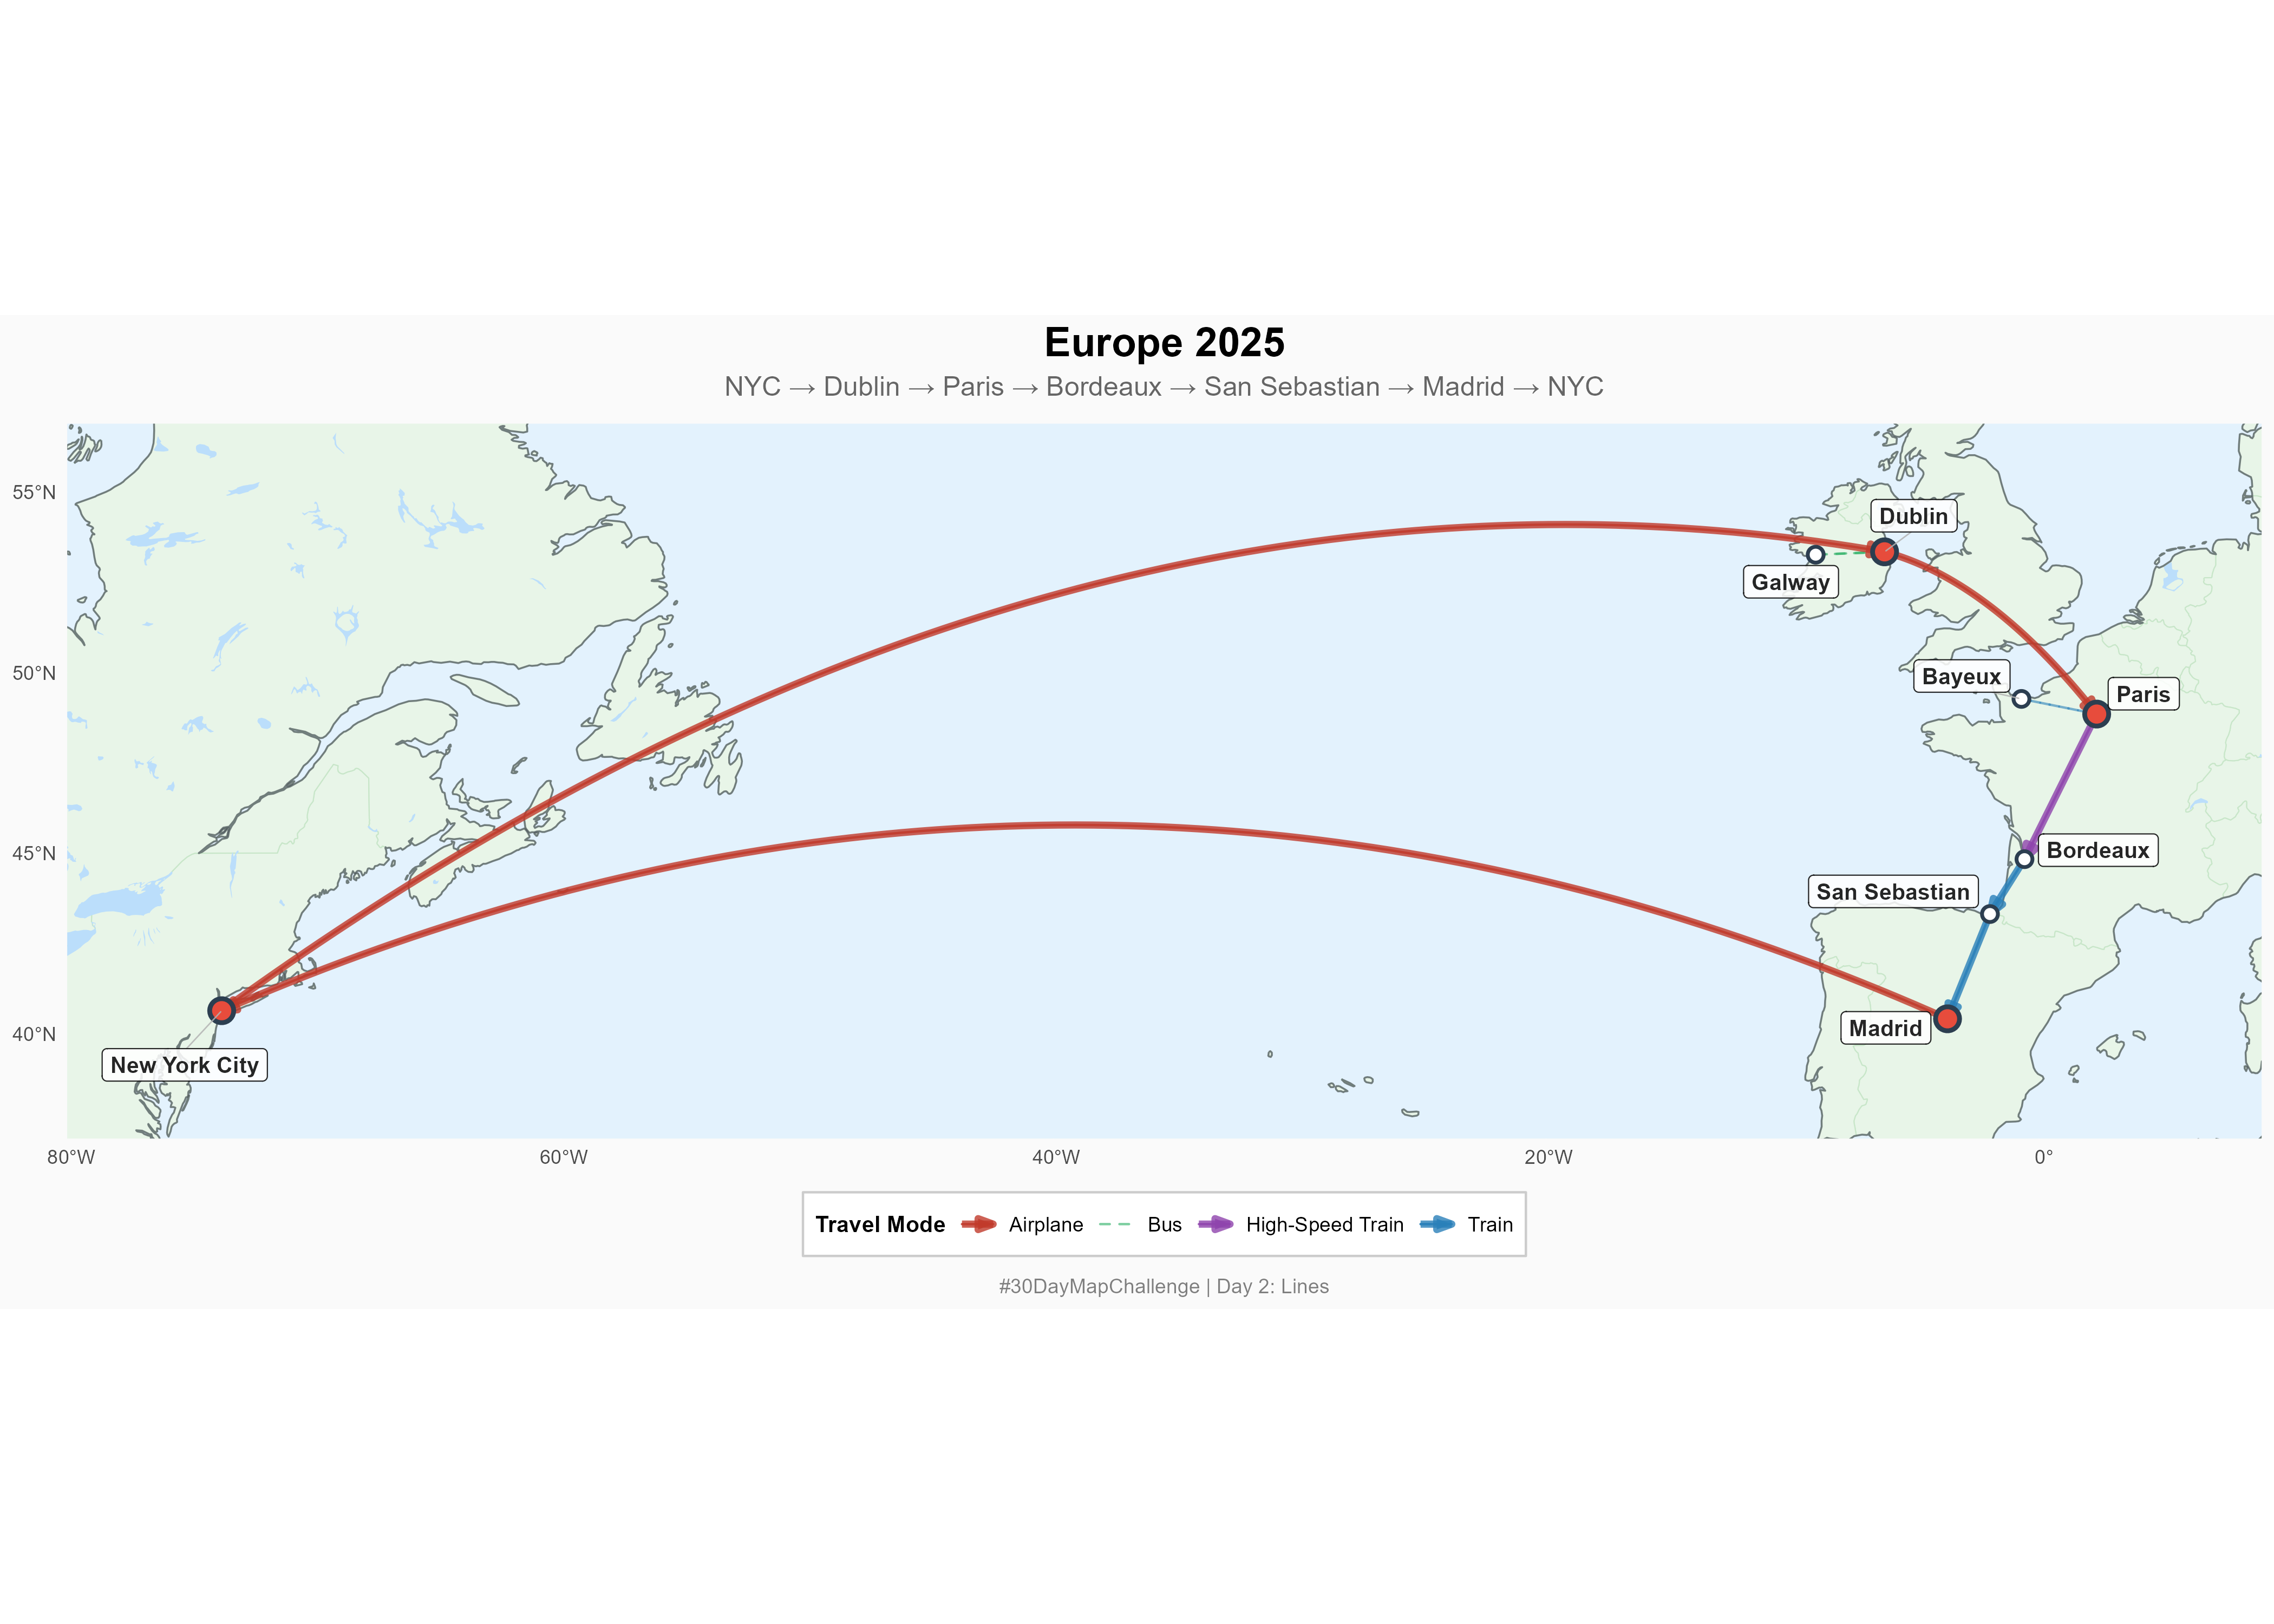
#30DayMapChallenge Day 2: Lines. I wanted to make a quick map of my summer vacation using #rstats. I couldn’t get the arrows to display correctly, so that is still a work in progress. GitHub: https://github.com/mhegeman/30DayMapChallenge_2025
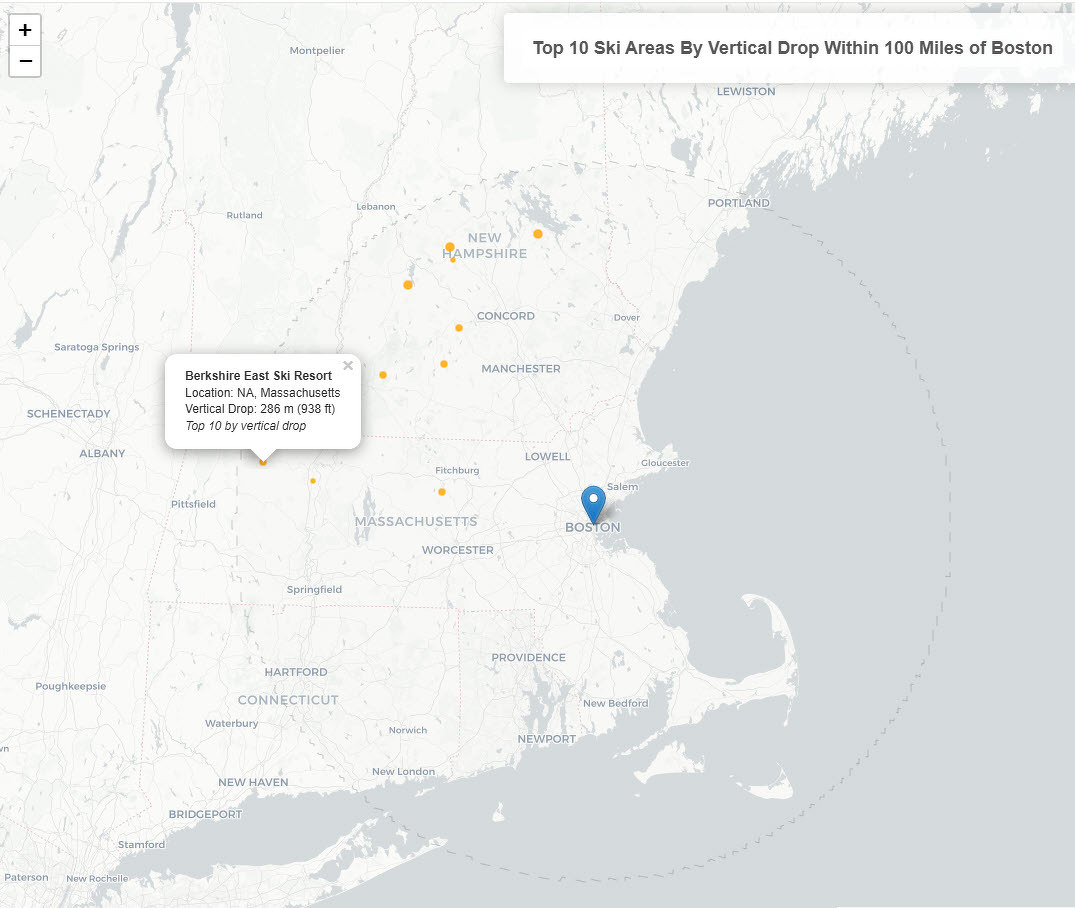
Trying to catch up on the #30DayMapChallenge Day 1: Points. Since it is almost ski season in the Northern Hemisphere, I wanted to find the top 10 ski resorts with the most significant vertical drop within 100 miles of Boston. I used data from Open Ski Map and made the map in R using Leaflet.
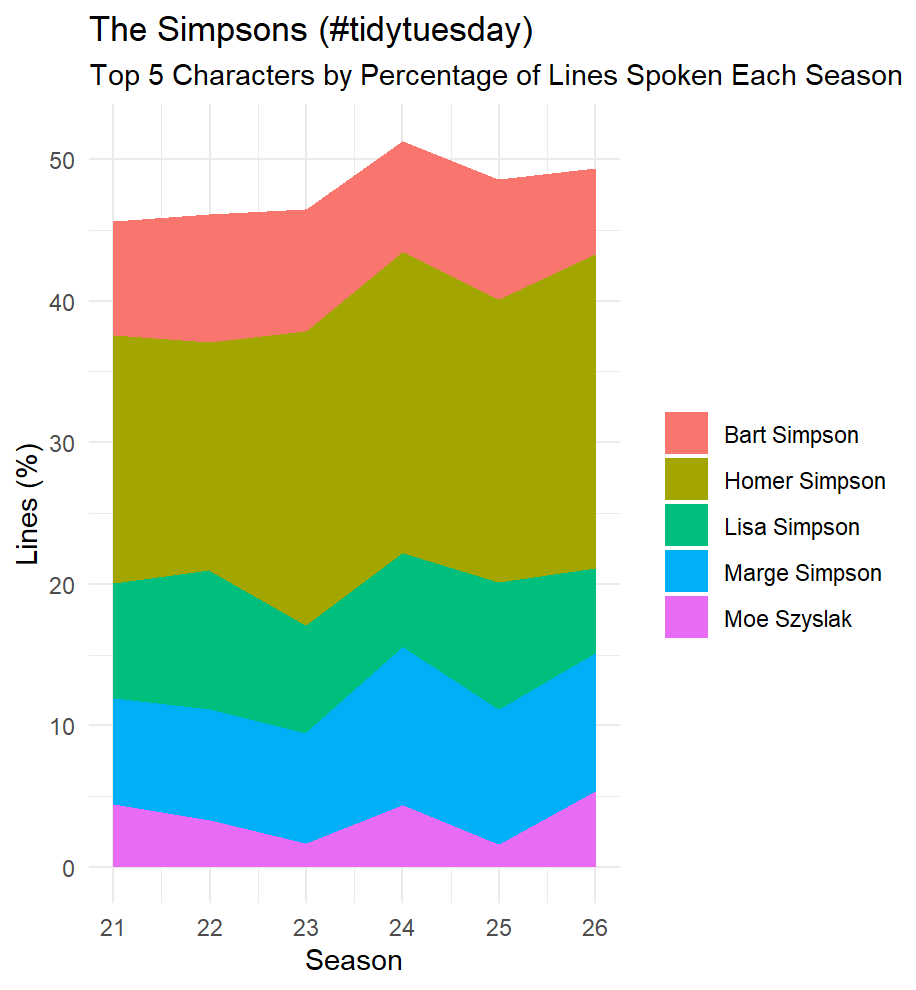
#tidytuesday I am a bit late on this, but the show is really all about Homer. Speaking lines by character for seasons 21-26.
Wednesday, December 11, 2024 →
Fell a bit off the #AdventOfCode wagon, but trying to get back at it. I work almost exclusively with dataframes as inputs, this reminds me that there are other data structures. Completed “Print Queue” - Day 5 adventofcode.com/2024/day/… GitHub: github.com/mhegeman/…
Just completed “Ceres Search” Day 4 of Advent of Code 2024. Part 1 was a breeze, boosting my confidence, but Part 2 fixed that. As usual, I was overthinking it. #Python #AdventOfCode adventofcode.com/2024/day/… Github: github.com/mhegeman/…
So, today, I learned about regex, which is not something that I have used before. I just completed “Mull It Over” - Day 3 - Advent of Code 2024 #AdventOfCode adventofcode.com/2024/day/… #Python
I just completed “Red-Nosed Reports” - Day 2 - Advent of Code 2024 #AdventOfCode I will eventually share answers on Github, but does anyone have a favorite resource to help with Python when you are coming from R? Ihttps://adventofcode.com/2024/day/2
Because I am a glutton for punishment, I’ve decided to give #AdventOfCode a try to practice my Python skills. I’ve completed “Historian Hysteria” - Day 1 - adventofcode.com/2024/day/…
Sunday, December 1, 2024
As the #30DayMapChallenge wraps up, I’ve taken time to think about my experiences during this experiment. Although I only completed some of the maps during the challenge, the maps I worked on helped stretch my skills beyond my comfort zone. I aimed to become more comfortable using R and open-source tools, and in that light, this challenge was a success. This is the final map - shelters in Antarctica. I’ve never worked with a polar projection before and was excited to try it.
Monday, November 25, 2024
Writing code and making maps with AI I need to catch up on the #30DayMapChallenge. Next year, I will plan a bit better to stay on track. In the meantime, I will fulfill a few topics with one set of maps - AI only (Day 9) and Map Projections (Day 26). I asked Claude.ai to write an R script to make a series of world maps showing different projections. I didn’t edit any of the code myself, but I went back and forth with Claude for about 20 minutes to refine how the maps looked.
Sunday, November 24, 2024
Now that I understand the basics of getting data into and out of a DuckDB file, I want to add spatial queries to the repertoire. You can find my blog post on creating and reading DuckDB data here: Duck DB + GIS. Spatial queries are a pretty common task in GIS. For example, you might want to find all of the restaurants within 5 miles of your hotel during a vacation.
#30DayMapChallenge Day 13: A new tool. I finally took the leap and experimented with DuckDB to create and access spatial data from #rstats. #gis #duckdb mel-likes-maps.micro.blog/2024/11/1…

Tuesday, November 19, 2024
I’ve been wanting to try DuckDB for a while. The lure of a serverless database is strong. But it always seemed intimidating. I recently read two articles that made me think that there’s no time like the present to give it a try: DuckDB: The Indispensable Geospatial Tool You Didn’t Know You Were Missing by Chris Holmes and # PostGEESE? Introducing The DuckDB Spatial Extension by Max Gabrielsson. I am going to share what I did to get points and polygons into a DuckDB database, then use that data to make maps.
Monday, November 18, 2024
The 30 Day Map Challenge is an annual social media event to challenge your self to make more maps. I’ve never participated before because it seemed very daunting to make all of these extra maps on my off time to share with the world. Particularly because many of the categories are types of maps and analysis that I don’t do often. But, what the heck? I probably won’t be able to complete them all, but some is better than none.
Monday, November 18, 2024
Welcome to Mel Likes Maps🗺️ I’ve always loved maps. For the past 15 years, I’ve been fortunate enough to turn this into a career in data analysis and Geographic Information Systems (GIS). As you can imagine, a lot has changed, and it takes a lot of effort to keep up. The goal of this blog is to be a space where I can document and share projects I’m working on and what I’ve learned.