AI and Projections
Monday, November 25, 2024
Writing code and making maps with AI
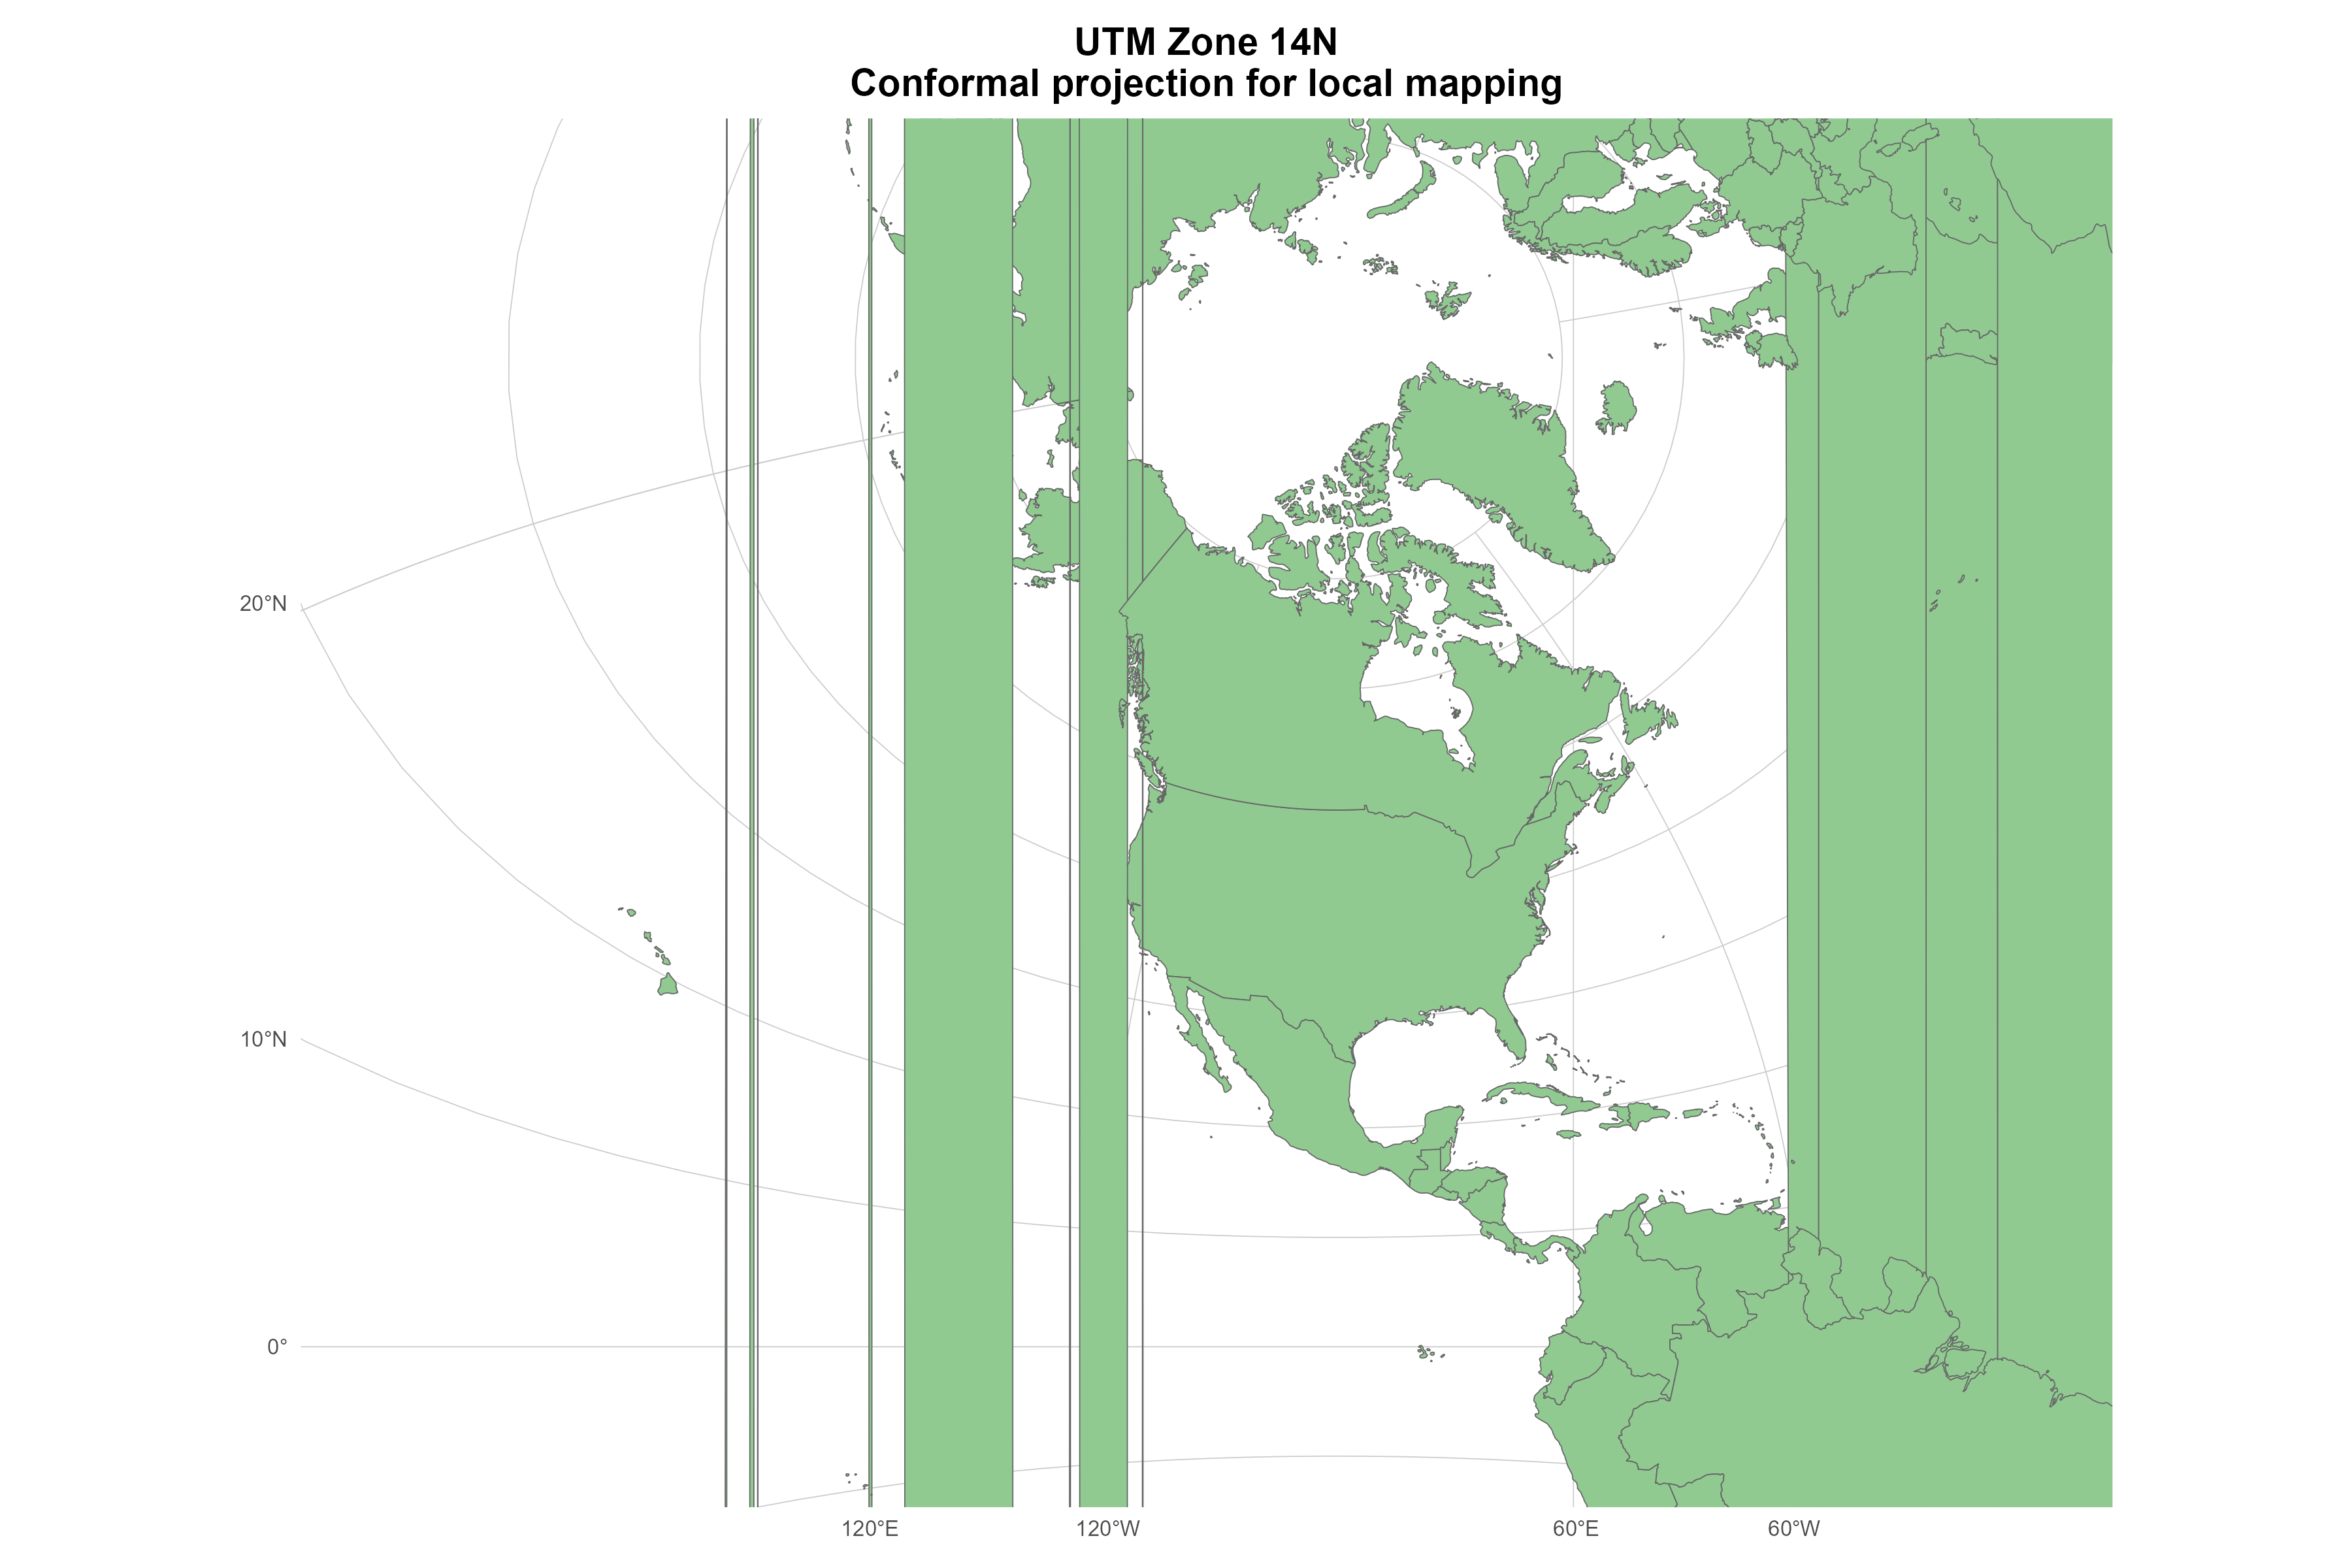
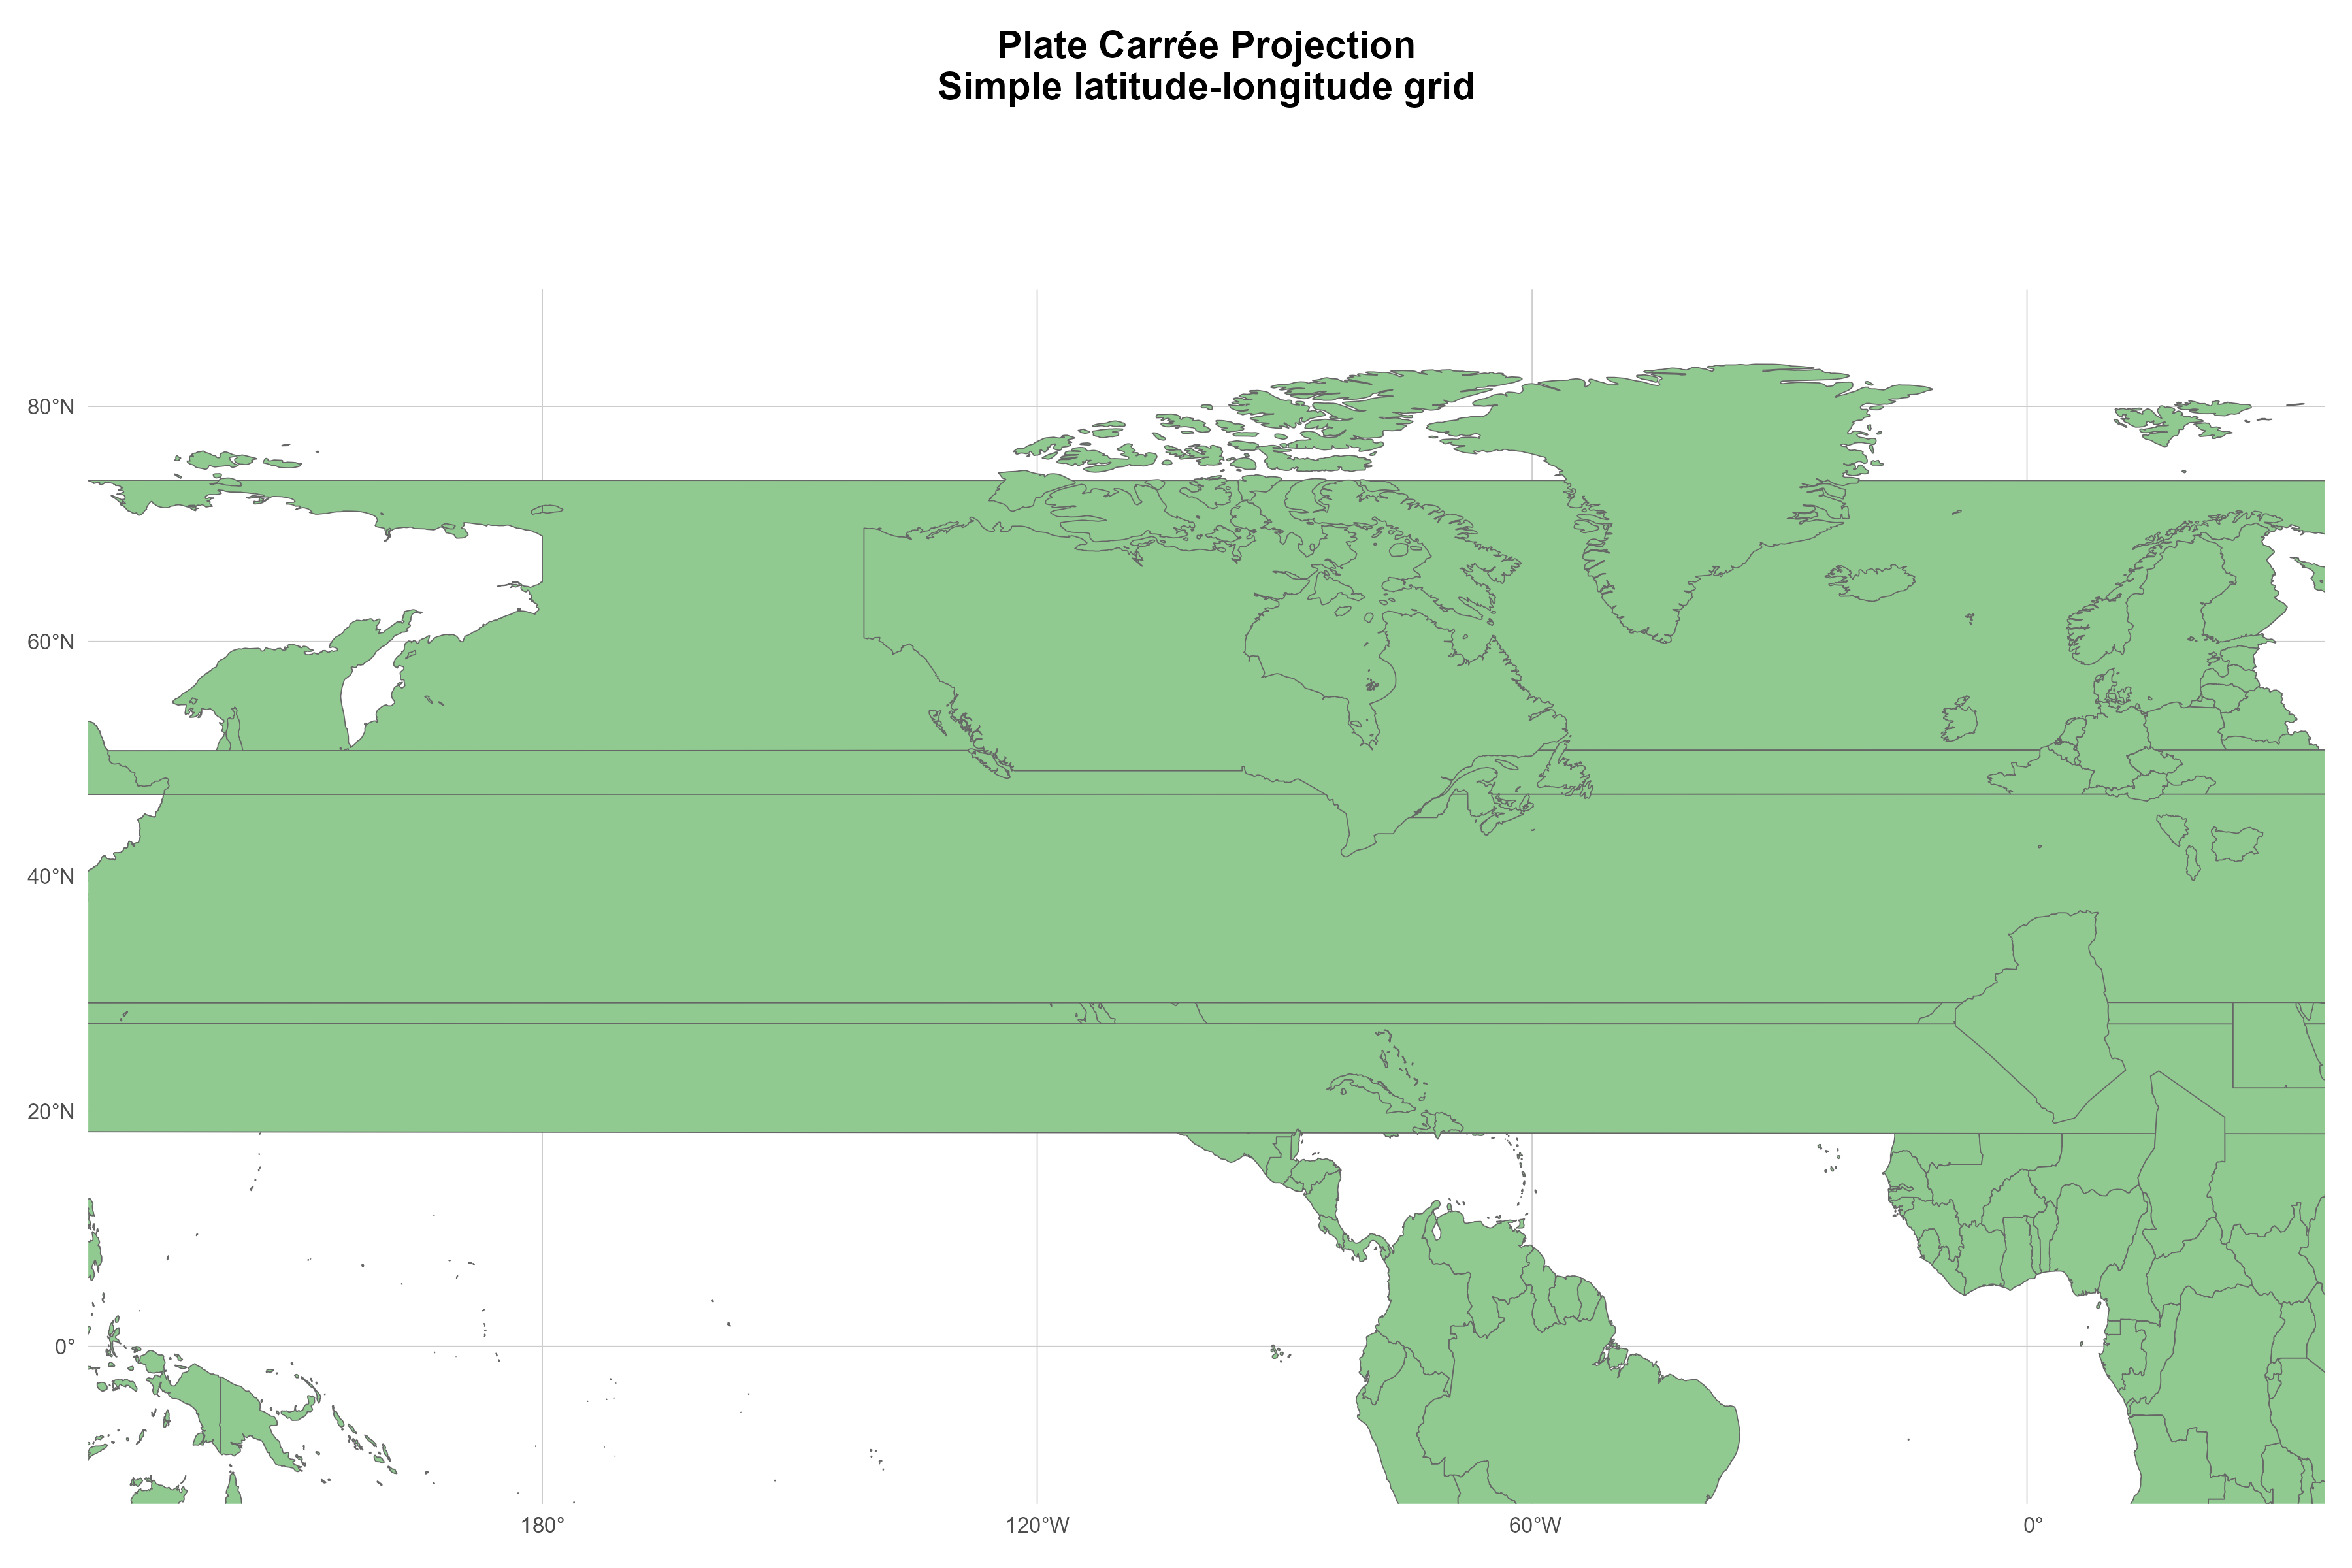
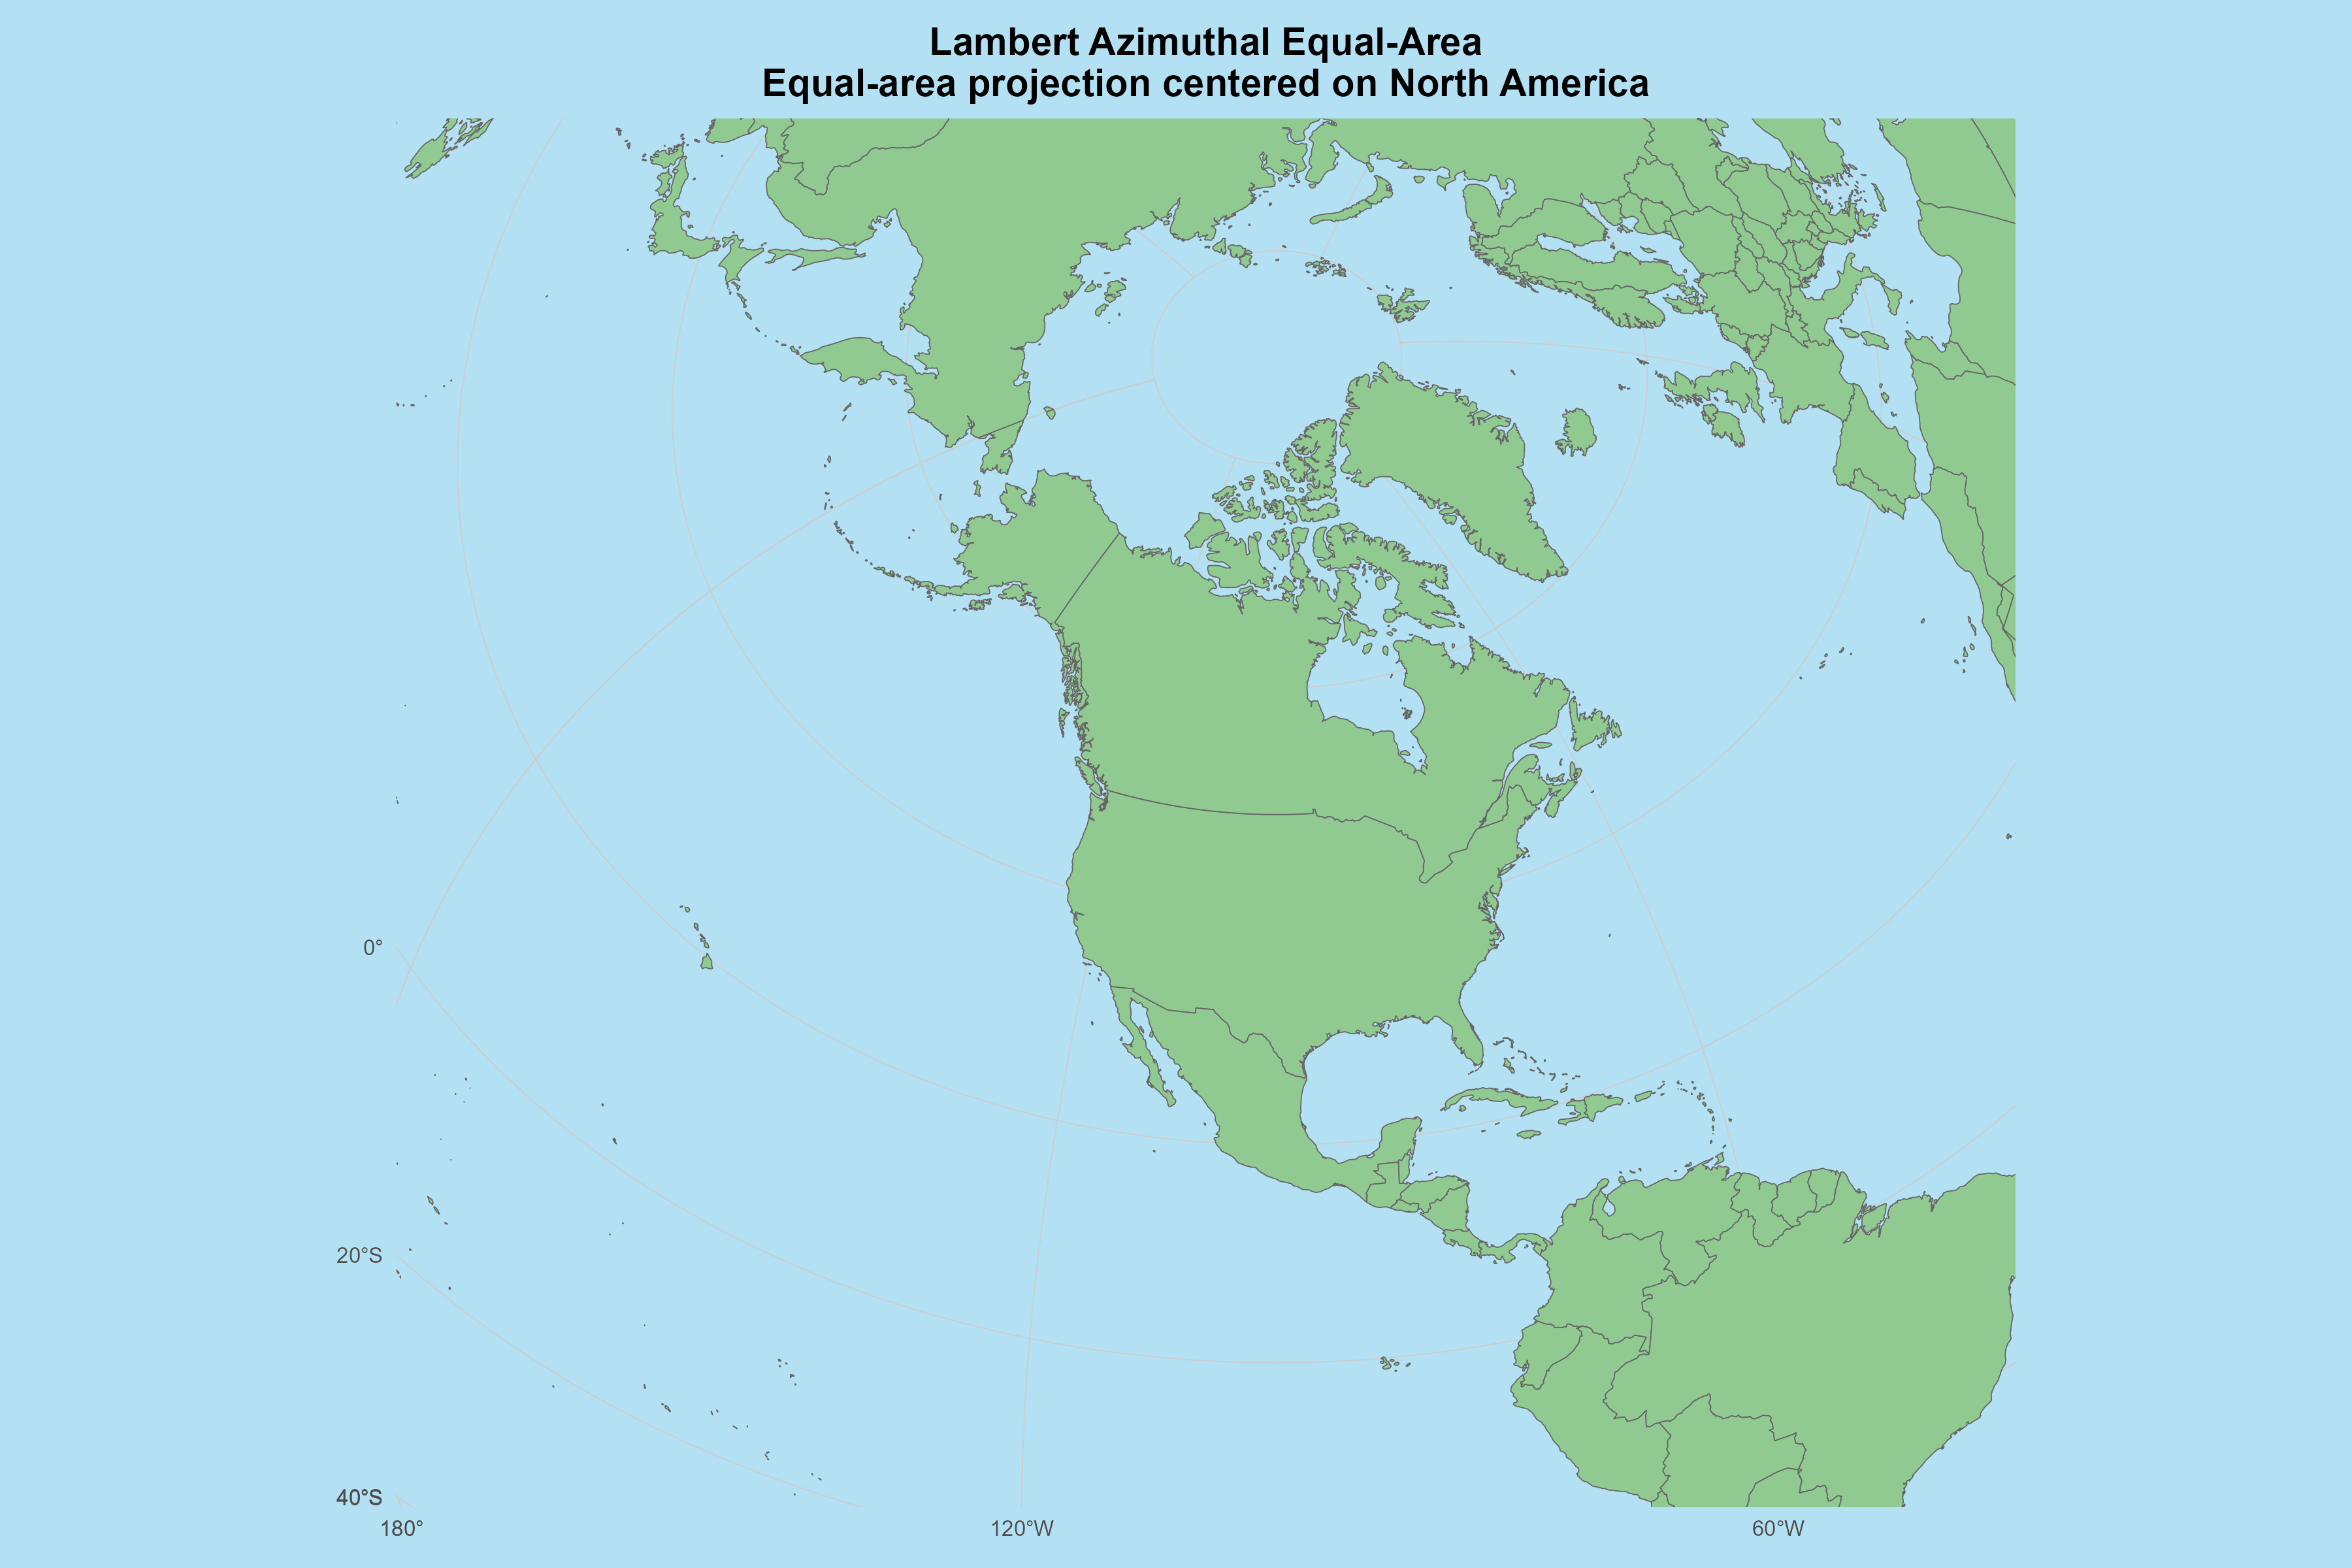
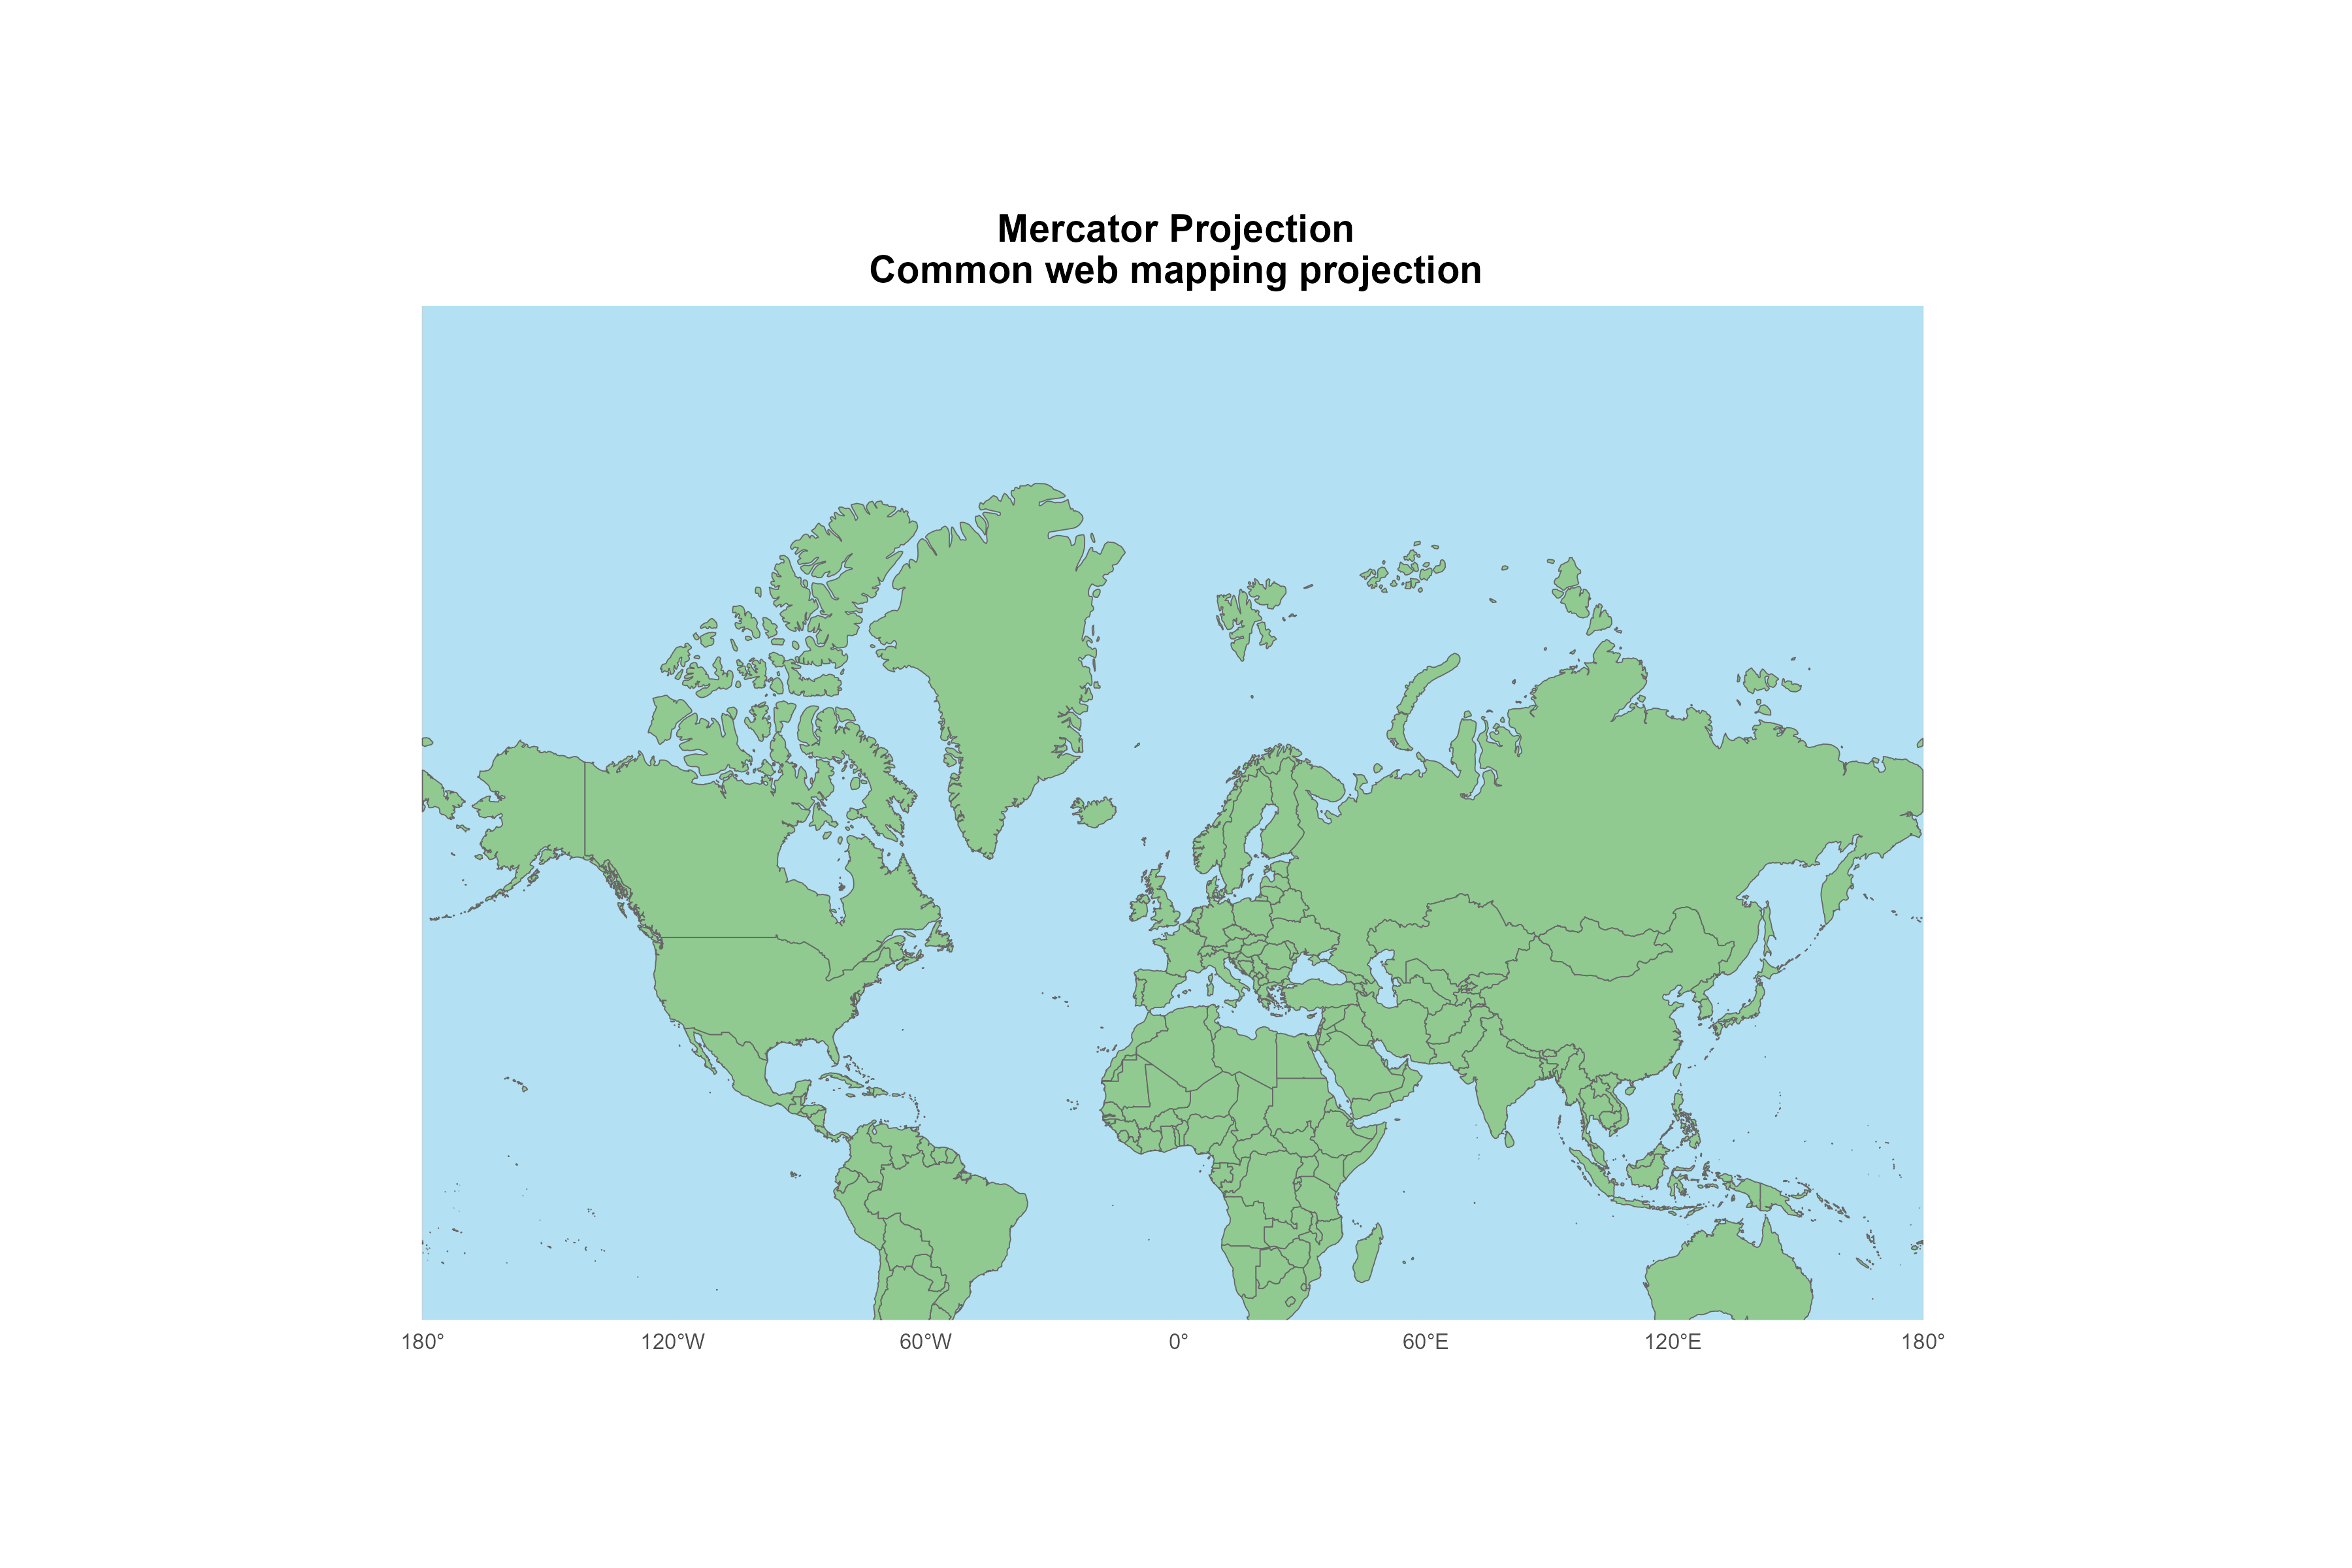
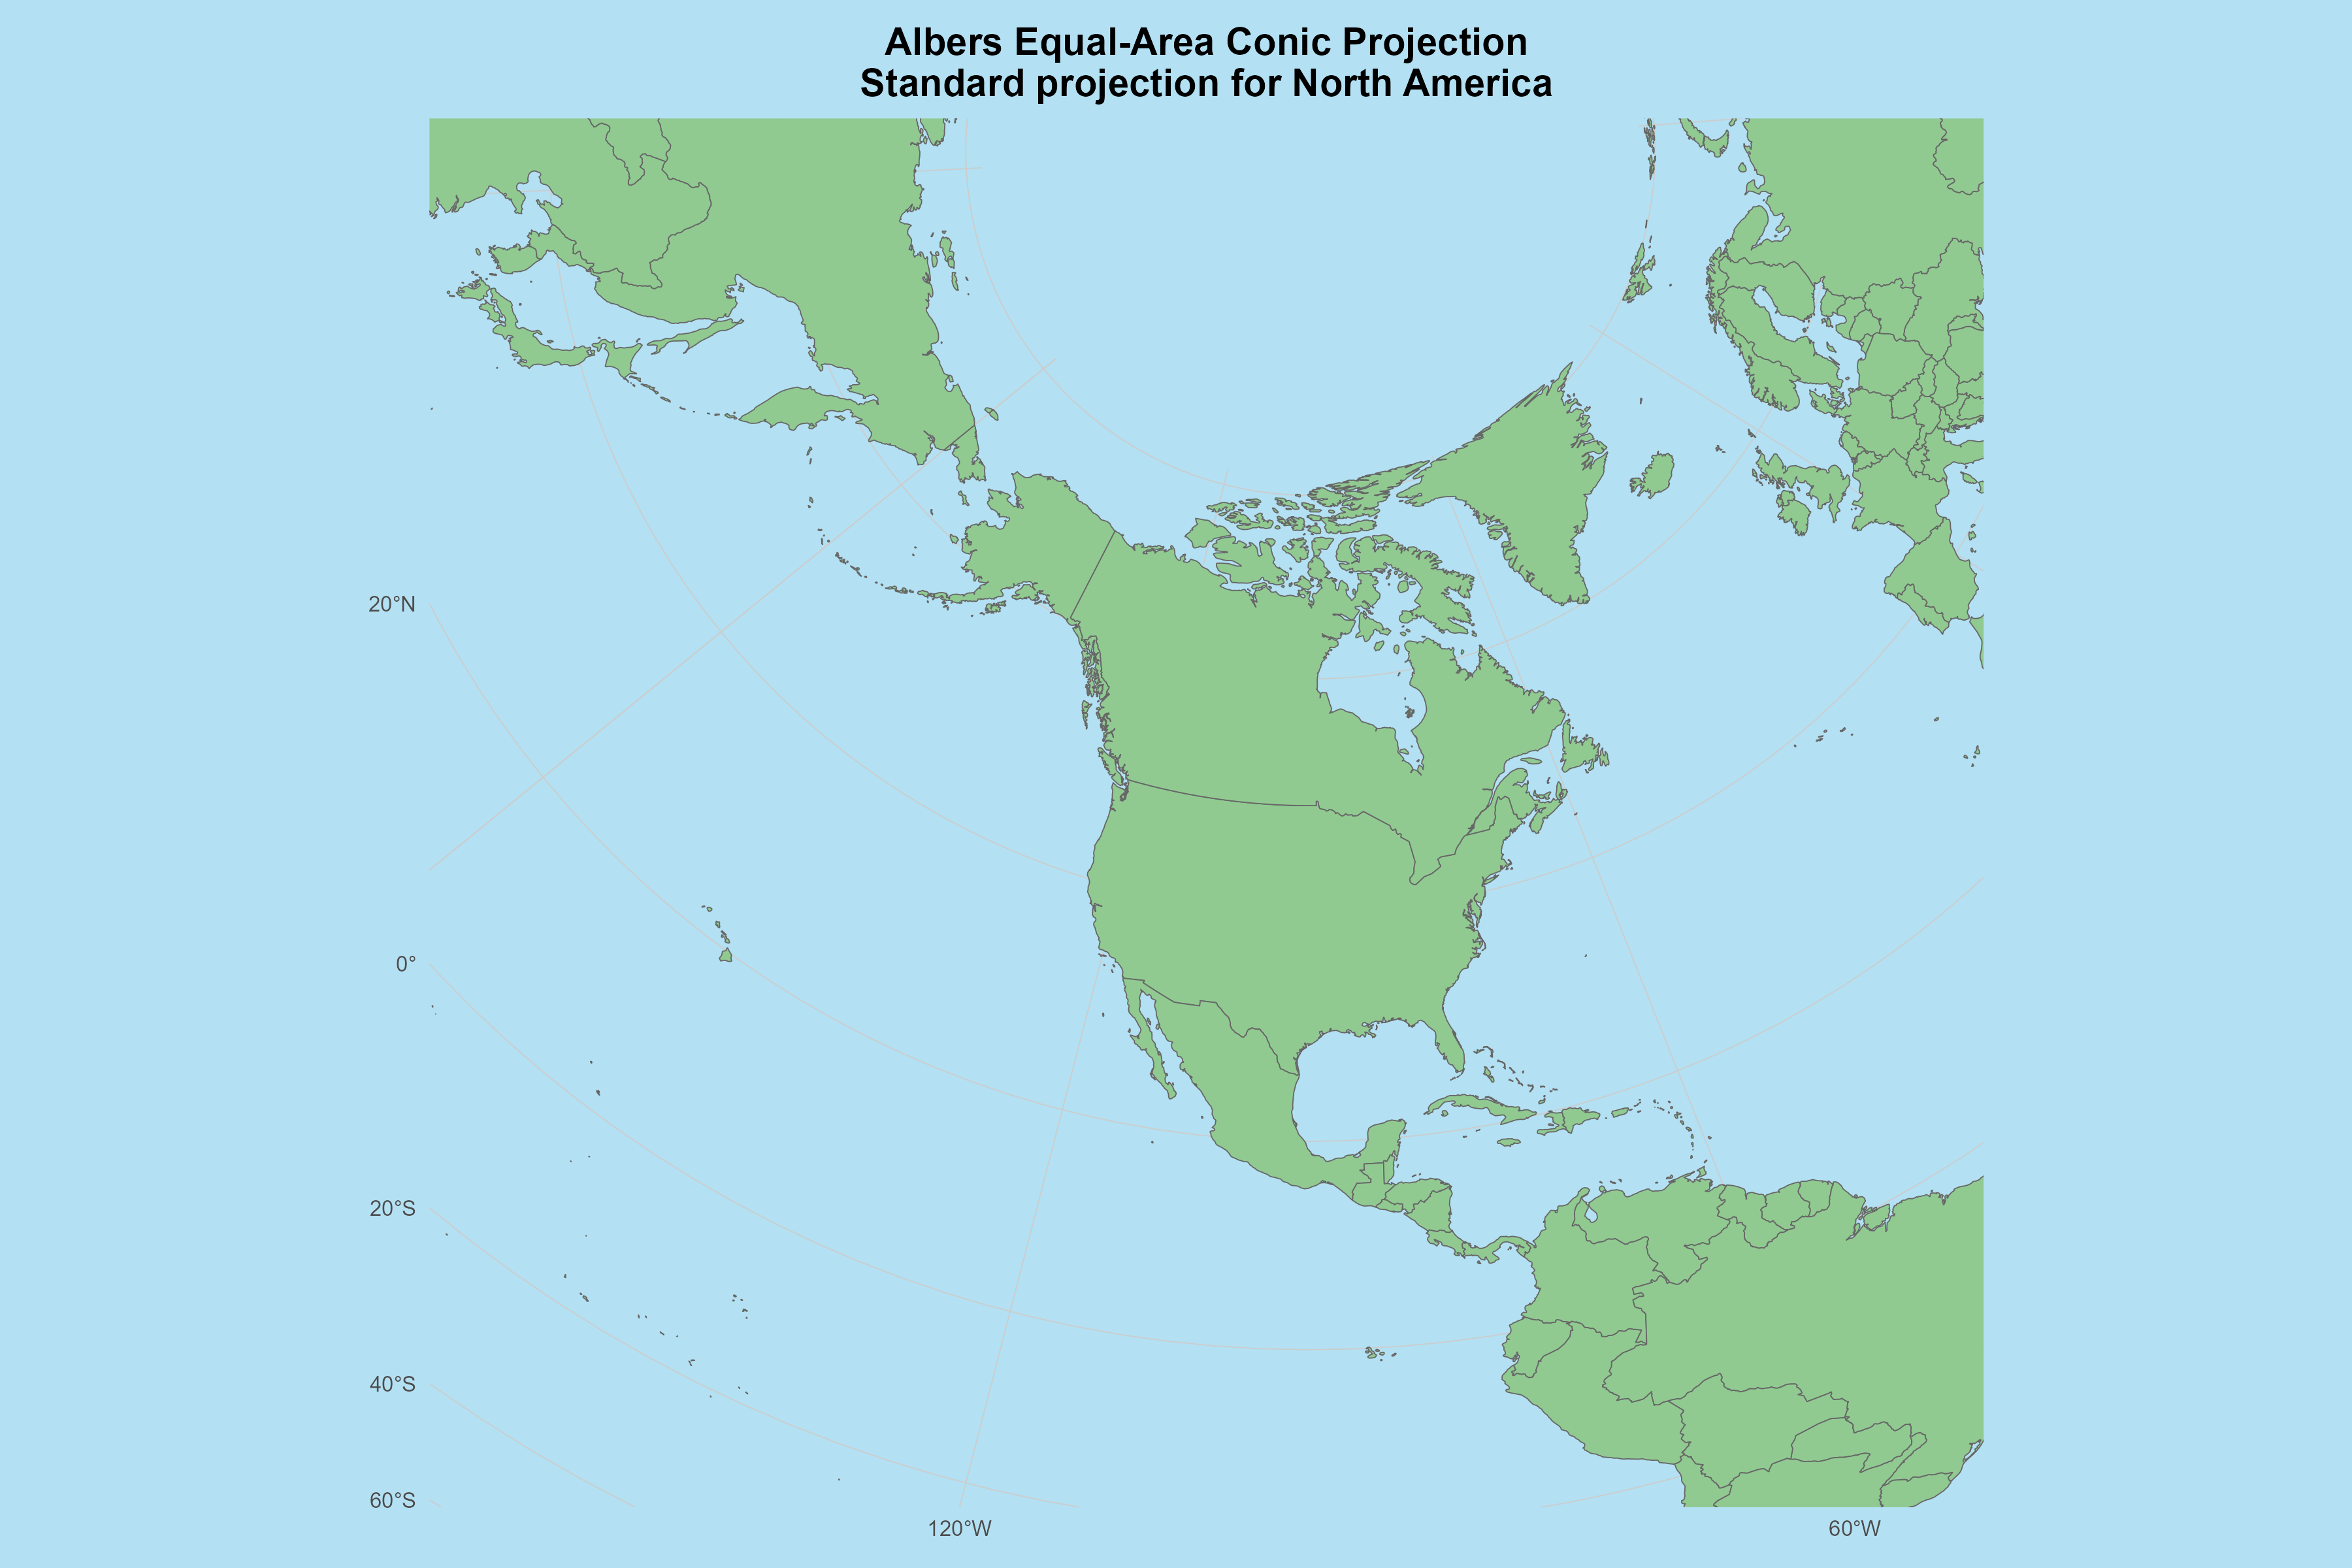
I need to catch up on the #30DayMapChallenge. Next year, I will plan a bit better to stay on track. In the meantime, I will fulfill a few topics with one set of maps - AI only (Day 9) and Map Projections (Day 26). I asked Claude.ai to write an R script to make a series of world maps showing different projections.
I didn’t edit any of the code myself, but I went back and forth with Claude for about 20 minutes to refine how the maps looked. The code and the prompts are on GitHub. The results are a mixed bag.
Here are the most successful examples:
Here are some of the worst: