Polar Mapping
Sunday, December 1, 2024
As the #30DayMapChallenge wraps up, I’ve taken time to think about my experiences during this experiment. Although I only completed some of the maps during the challenge, the maps I worked on helped stretch my skills beyond my comfort zone. I aimed to become more comfortable using R and open-source tools, and in that light, this challenge was a success.
This is the final map - shelters in Antarctica. I’ve never worked with a polar projection before and was excited to try it. For the data, I turned to Open Street Map data available through HDX, focusing specifically on shelters in Antarctica. This map checks off multiple categories from the challenge list! 😊
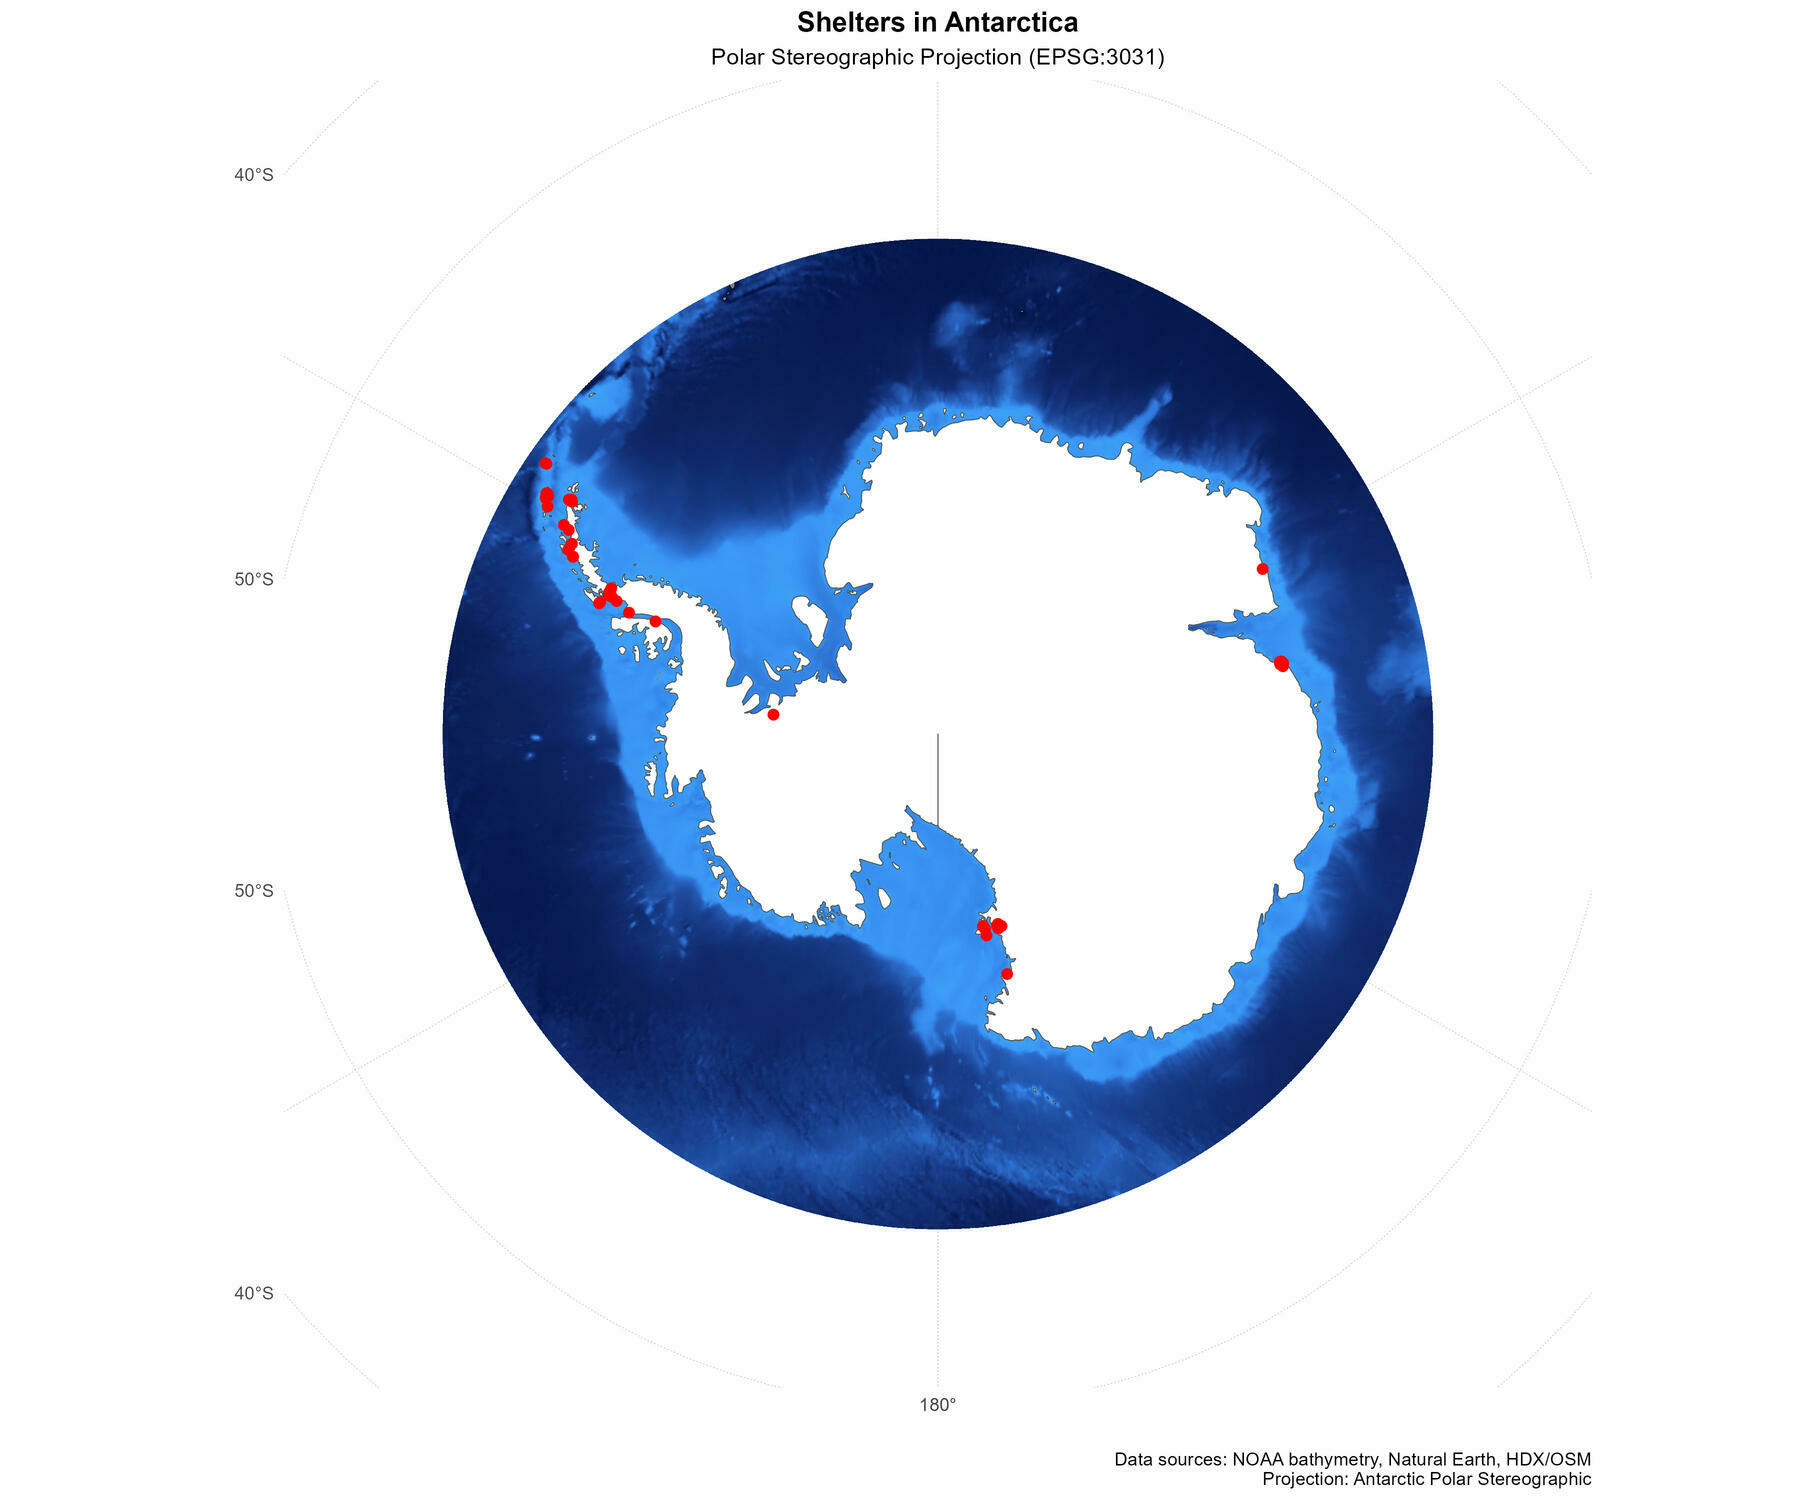
The map employs a polar stereographic projection, which is particularly suited for representing regions near the poles. This technique allows for a clear depiction of various shelter locations scattered across the icy landscape of Antarctica.
Curious about the locations? All the code and data used to create this map are on my GitHub page.